US question globalisation whilst India embrace global trade

The Belt and Road Initiative (BRI) is a development strategy proposed by the Chinese government that focuses on connectivity and cooperation between Eurasian countries. Through infrastructure development China wants to boost trade and stimulate growth across Asia and into Europe. Ratings agency Fitch said that $900bn in projects were planned or in progress.

India is a country that will benefit from this development and recently Prime Minister Modi positively responded to Chinese President XI Jinping’s vision of the world – the BRI being the most obvious and a catalyst to India’s foreign policy aims which responds to the global trends. These are:

  1. India has the potential to become the world’s third largest economy by 2030. It intends to do this by sharing prosperity and working with other countries to set joint goals.
  2. Political ideologies are now encompassing equity and environmental issues. In India they are becoming more main stream policies for government and sustainable resources use is important in the 21st century.
  3. India is looking at Asia as the largest common market. Asia is reverting to its historical equilibrium of an integrated continent and does not want to choose between India or China. Instead, it supports a resetting of their relations to shape the goals of the ‘Asian Century’, which include the Bell and Belt Initiative and security related differences.
  4. India has a comparative advantage in the digital world and the potential to be the engine behind global growth.
  5. India priority is settling the boundary issues with its neighbours, enhancing diplomatic leverage and building a $10 million economy.

China is trying to improve international norms, technical standards and institutions through the BRI which covers more than 900 projects – 76 ports and terminals in 34 countries and special arbitration courts, about 80% which are contracted to Chinese companies. Whilst Prime Minister Modi is trying to divert the Western framework for reducing emissions in favour of human well-being within ecological limits.

And as the rivalry between the US, and Russia and China intensifies, India can play a stabilising role on agreed goals within the framework of a multi-stakeholder in the “Asian Century”.

Source: Neighbors move toward ‘Asian Century’ – ChinaDaily 28-29th April 2018

Strong case for a Universal Basic Income in India but is it realistic?

UBI IndiaI have blogged about the UBI and read about how India would provide a strong case for its implementation. The rationale for this is the fact that India’s welfare programmes (950 that the central government run) are numerous, inefficiently run and encourage corruption. Add to those the programmes run by each state and you have a bureaucratic nightmare unfolding. However this has been part of Indian society and not so long ago it took businesses 6 months to acquire a permit to import computers. The UBI was raised as an alternative to the inefficiency of welfare handouts and this unconditional cash payment be disbursed not just to the poor but to everyone. In more advanced countries the case for UBI is based on technology making many jobs obsolete and no new jobs being created in their place. Although this is not the case in India and it warrants the UBI for other reasons:

1. UBI is easier to administer than India’s current antipoverty programmes which largely take the form of subsidies paid to sellers of grain, fuel, fertilizer and other essentials. Current programmes are plagued by waste, corruption and abuse. UBI would save 2.07% of GDP.

2. By making everyone eligible, a universal basic income removes the messy task of identifying who is and who isn’t in need of assistance.

3. By paying money directly into bank accounts, it would allow India to do away with the vast administrative machinery currently needed to supply the poor with cheap wheat, rice and other goods.

4. By one estimate, around one-third of the grain set aside for India’s food-welfare program never reached the intended beneficiaries in 2012, the most recent year for which comprehensive data are available. Payments under a giant rural-work program are regularly delayed, leaving families in the lurch.

5. paying a basic income directly into bank accounts would encourage more people to use formal financial services, which would then help banks invest in expanding access to banks and ATMs.

Concerns

1.  households—“especially male members”—may fritter away their basic income on liquor and tobacco

2. India’s underdeveloped financial infrastructure could make it hard for many people to access their entitlements. According to the World Bank, there are only around 20 ATMs for every 100,000 adults in India, compared with 70 in South Africa, 114 in Brazil and 132 in the U.K. Although the government says it has helped open 260 million bank accounts since 2014, one-third of Indian adults remain unbanked.

3. The government paper suggests that 25% of the population should be excluded in order to make it more affordable. However deciding who is poor and who isn’t an easy task especially when over 35% of the richest 1% of Indians benefit from subsidized food to which they are not entitled.

4. There is a risk that a UBI would just supplement the welfare programmes rather than replacing them.

Source: The Economist – Wall Street Journal

Contributions to world GDP 2013-16

The Economist produced a graph showing world GDP data and made the following points:

  • India and China account for 65% of world growth
  • Emerging markets contributions in 2016 were down to its lowest figure since 2008 – falling commodity prices would have been a factor
  • Norway contributed less to global GDP with lower oil prices being prevalent.
  • USA with increased government spending and greater export volumes improved its position
  • Brazil has been in negative territory since mid 2014 – interesting point with significant government spending on hosting the Football World Cup and the Olympics.

Maybe a good starter for your classes asking the question who contributes most to world GDP?

World GDP 2013-16.png


India and Venezuela’s battle to purge the shadow economy.

India Ruppee notes.jpgOn the 8th November last year India’s Prime Minister, Narendra Modi, announced that all 500 and 1000 rupee notes could no longer be used as a medium of exchange – this accounts for 86% of cash in circulation. These notes could be exchanged for new ones by the end of the 2016.

Why did they outlaw the use of 500 and 1000 rupee notes?

  • The main motivation was to remove the country of shadow economy millionaires hoarding of illegal cash. It is estimated that the shadow economy accounts for 20% of India’s GDP.
  • Demonetisation increases the use of electronic banking allowing better tracking by tax authorities.
  • The printing of new denomination money would hopefully inflate away the value of illegal cash in the shadow economy.
  • Encourage people to deposit cash in the bank where it would earn interest
  • Greater tax revenue for the government by firms declaring their earnings. This additional money could be used for infrastructure projects as well as tax incentives for companies.

What have been the problems?

  • The Reserve Bank of India hasn’t been able to print the new money fast enough to replace the $207bn in rupees. There has been almost no new cash in rural banks and therefore keeping millions of farmers deposits that total $46bn. With limited cash in rural areas prices have collapsed.
  • Factories in some cities have closed as employers can’t pay their workers although some have resorted to giving supermarket coupons to keep workers on the job.
  • A dentist in an affluent part of Delhi has found a 70% fall in business since the cash ban.
  • Outside the major cities cash transactions are very common and not recognising 500 and 1000 rupee notes provides a significant monetary shock for those areas
  • Not all the shadow economy can move to a more legal environment with demonetisation and this represents a potential loss of economic activity.
  • A shortage of cash has led to small businesses having to shut down.

In the long-run the forced priming of bank accounts and the switch to electronic payments will mobilize more money for lending and taxes.

Demonetisation.pngVenezuela

Venezuela also became a country mostly without cash on December 16, sparking scattered protests and looting around the country as people fumed at having their already limited purchasing power cut off almost entirely.

As the nation’s most widely used banknote went out of circulation, the higher-denomination bills that were supposed to replace the 100-bolivar note had not yet arrived at banks or ATMs. That forced people to rely on credit cards and bank transfers or to try to make purchases with bundles of hard-to-find smaller bills often worth less than a penny each. The government was forced to delay the withdrawal of the 100-bolivar banknote until January 2. The graphic shows the volume of bank notes that are required to make $10m – Venezuela needs 14 sizable trucks to carry the 100-bolivar banknotes.

Source: The Economist – December 3rd 2016

India to benefit from Chinese slowdown

A HT to my good friend Kanchan Bandyopadhyay for this piece in ‘The Times of India’. Amid the global economic gloom, triggered by a slowing Chinese economy, most economists maintained that India’s growth prospects were brighter than those of other emerging markets. Here are a list of reasons:

1. GDP growth estimated at 8% in 2015-16. India considered a bright spot in global economy
2. Improving industrial output: Up 3.8% in June compared to 2.5% in May
3. Healthier government finances: Improved tax collections, led by indirect tax growth of 37.6% during April-July Lower subsidy bill due to falling oil prices; expected savings may be around Rs 1 lakh crore
4.Inflation, both retail and wholesale, under control. Retail inflation estimated at 3.8% in July; wholesale inflation at -4.1%, the ninth straight month of contraction
5. Better than expected monsoon rains; deficit of around 11% but distribution has been encouraging
6. Lower trade deficit due to a fall in import bill for crude petroleum, gold
7. Current account deficit appears more manageable at 1.3% of GDP in 2014-15 compared to 1.7% in 2013-14
8. Forex reserves at a record $355 billion
9. Early signs of increase in investment
10. Healthy demand in consumer sectors, uptick in consumption

Here is a very informative graphic – The Elephant v The Dragon.

elephant v Dragon

A2 Revision – GDP calculations and the Indian shadow economy

You will no doubt come across the 3 methods of calculating GDP that is in the macro syllabus of most courses. Here are the main features of each.

National Income measures the value of output produced within the economy over a period of time. One of the key economic objectives of government is to increase the level, and rate of growth, of national income. Before we start to analyse why economic growth is so important, it is important to be able to define the key concepts.

GROSS DOMESTIC PRODUCT (GDP)

Under new definitions introduced in the late 1990s, Gross Domestic Product is also known as Gross Value Added. It is defined as the value of output produced within the domestic boundaries of the NZ over a given period of time, usually a year. It includes the output of foreign owned firms that are located in NZ, such as the majority of Trading Banks in the market – ASB, National, ANZ etc. It does not include output of NZ firms that are located abroad. There are three ways of calculating the value of GDP all of which should sum to the same amount since by identity:

NATIONAL OUTPUT = NATIONAL INCOME = NATIONAL EXPENDITURE

1. THE EXPENDITURE METHOD

This is the sum of the final expenditure on NZ produced goods and services measured at current market prices (not adjusted for inflation). The full equation for calculating GDP using this approach is:

GDP = Consumer expenditure (C) + Investment (I) + Government expenditure (G) + (Exports (X) – Imports (M))

GDP = C + I + G + (X-M)

2. THE INCOME METHOD
This is the sum of total incomes earned from the production of goods and services. By adding together the rewards to the factors of production (land, labour, capital and enterprise), we can see how the flow of income in the economy is distributed. The rewards to the factors of production can be loosely summarised in the following table:

Factor Reward
Land – Rent
Labour – Wages and Salaries
Capital – Interest
Enterprise – Profit

Only those incomes generated through the production of a marketed output are included in the calculation of GDP by the income approach. Therefore we exclude from the accounts items such as transfer payments (e.g. government benefits for jobseekers allowance and pensions where no output is produced) and private transfers of money.

The income method tends to underestimate the true value of output in the economy, as incomes earned through the black economy are not recorded.

3. THE OUTPUT MEASURE OF GDP

This measures the value of output produced by each of the productive sectors in the economy (primary, secondary and tertiary) using the concept of value added.

Value added is the increase in the value of a product at each successive stage of the production process. For example, if the raw materials and components used to make a car cost $16,000 and the final selling price of the car is $20,000, then the value added from the production process is $4,000. We use this approach to avoid the problems of double-counting the value of intermediate inputs. GDP will, therefore, be equal to the sum of each individual producer’s value added.

Problems of accuracy:
Officially data on a nation’s GDP tends to understate the true growth of real national income per capita over time e.g. due to the expansion of the shadow economy and the value of unpaid work done by millions of volunteers and people caring for their family members. There may also be errors in calculating the cost of living

The scale of the informal “shadow economy” varies widely across countries at different stages of development. According to the IMF, in developing countries it may be as high as 40% of GDP; in transition countries of central and Eastern Europe it may be up to 30% of GDP and in the leading industrialised countries of the OECD, the shadow economy may be in the region of 15% of GDP.

cashIndia’s cash economy

It is believed that in 2009 Indians held more money is Swiss banks than people from all other countries combined.
– A 2010 study by the World Bank has suggested that India’s shadow economy is equivalent to 20% of GDP.
– Research indicates that 85% of jobs in India are typically cash orientated.
– Only 42,800 people declare income of over 10m rupees a year – only 2.5% of Indians pay income tax.
Mumbai has a huge stock of empty apartments held as investments, their owners unwilling to to sell for fear that the proceeds might enter the formal economy and be taxed.

Source: The Economist. March 23rd 2013

The Journey of the Indian Onion – A diseconomies of scale story

No doubt you have come across the movie documentary “Black Gold” which looks at the global coffee industry focusing on the plight of coffee farmers in Southern Ethiopia. The Indian onion market has similar characteristics and it is the farmers that lose out the most. Here are some of the issues that they have encountered:

* Higher rural wages have pushed up farmer’s costs
* Farms are small and therefore lack potential economies of scale
* The supply chain involves 5 middlemen who take their cut on the way through
* The onion is loaded, sorted or repacked at least 4 times
* Retail prices are double what farmers get
* Poor quality onions get dumped as there is no modern food-processing industry in India where they could be put to use.
* Little stock of onions is held in reserve so prices can vary greatly

Foreign food companies, including Walmart, Carrefour and Tesco, have been keen to make inroads into the Indian market. This would undoubtedly reduce the number of middlemen who take their cut on the way through and the development of modern storage facilites would assist in stabilising onion prices.

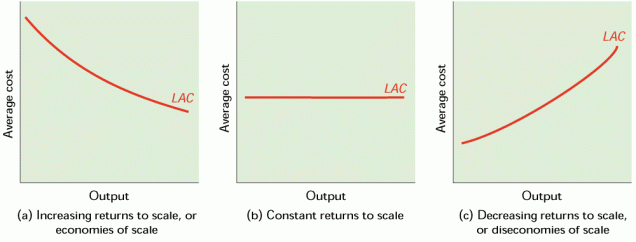
Economies Diseconomies

Sinking Rupee

If you are revising exchange rates here is a video clip from AlJazeera. India’s rupee has plunged more than 3.6 percent to a new record low against the US dollar amid deepening economic woes.

The rupee, one of Asia’s worst-performing currencies this year, breached 68.75 against the dollar in morning trade on Wednesday, after sliding three percent a day before.

The rupee has now fallen about 19 percent so far this year, by far the biggest decliner among the Asian currencies tracked by Reuters. The need to attract foreign capital is critical for a country whose record high current account deficit is a key reason behind the rupee’s slump.

Yet policymakers have consistently struggled to come up with measures that can convince markets they can stabilise the currency and attract funds into the country.

Those comments came after the government approval of infrastructure projects were overtrumped by concerns about the fiscal deficit after India’s lower house of parliament this week approved a 1.35 trillion rupees plan to provide cheap grain to the poor.

That failure is becoming an increasing source of tension for India at a time when fears of a possible US-led military strike against Syria are knocking down Asian markets, with the prospect that the Federal Reserve will end its period of cheap money as early as next month further raising concerns.

India needs to boost manufacturing

The Economist recently did a Special Report on India and one of the problems that it mentioned was the lack of a manufacturing sector. Unfortunately unlike the rest of South-East Asian economies over 50% of the workforce are still involved in the agricultural sector. However it is interesting to see the breakdown of GDP per sector:

Service sector makes up 59% of GDP and is still expanding,
Agriculture 19% and
Manufacturing 22%.

The Economist suggests that more factories could provide jobs that would ease the pressure of 13m people that join the Indian workforce every year. What are the issues regarding its expansion:

* Bureaucracy and a poor infrastructure
* Labour costs are relatively high compared to other East Asian countries
* High cost of credit
* Weaker ruppee makes it advantageous for overseas companies to base their production

But there seems no prospect of a big leap in Indian manufacturing in the near future. And if services are to keep expanding, the country needs huge quantities of skilled labour that will not be easy to come by.


Source: The Economist – September 29th 2012

BRIC Update

With the CIE A2 Paper 4 exam approaching I thought it would be useful to update what is happening in the BRIC countries – remember developing countries is a popular area that is examined. I was very fortunate to attend the Tutor2u 10th Anniversary Conference in June this year where one of the keynote speakers was Jim O’Neill of Goldman Sachs who coined the acronym in a 2001 paper entitled “Building Better Global Economic BRICs”.

The BRIC’s are struggling hard to ease policies and maintain economic growth in the face of a slowing global economy not of their own making. Although you might think that these rates are high in a developed nation for these 4 developing countries growth rates need to be maintained at much higher levels in order to keep apace with the factors of production that are coming on stream.

One of the reasons for the slowdown is the economic situation in Europe and the downturn on the USA followed by their own uncertainty associated with the coming fiscal cliff. There are also consequences of the BRIC slowdown are on the commodity market. BRIC countries were the reason behind the economic growth in the past decade, which meant they had a great affect on commodity prices. As economic growth decelerates rapidly in these countries, so does energy and commodity demand. Downward pressure on oil prices and other key commodities, such as copper, are likely to continue until one can be sure that the growth trend in the emerging market countries is moving higher again. We are not at that stage yet. BRIC nations, in their own

Other reasons for the growth slowdown is the ever worsening economic situation in Europe, followed closely by the general lack of economic leadership and market confidence coming from the aging industrial countries. One cannot, however, lay all of the economic challenges in the BRIC countries at the doorstep of Europe’s debt crisis and the massive policy uncertainty associated with the coming fiscal cliff in the US.

BRIC currencies represent high-risk, high- return carry trades, due to the near-zero level of interest rates in the U.S., Europe and Japan compared to the much high rates in the emerging market world. When BRIC currencies start to appreciate it will be a sign of confirmation of two important new trends.

1. A necessary, but not sufficient, condition for BRIC currency appreciation is that the global deleveraging process is abating.
2. To complete the scenario, economic growth and the ability to attract capital needs to return to the BRICs.

Source CME Group Market Insights – 25th July 2012

BRIC’s in 2011 – Source: The Economist – 29th Sept 2012

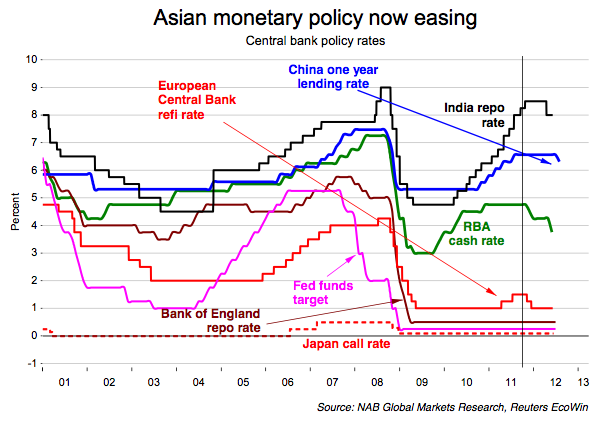
Central Bank Policy Rates – China cuts for first time since GFC

The Chinese authorities have cut interest rates for the time since the Global Financial Crisis (GFC). One year lending and deposit rates were cut by 0.25%.

Lending rate – 6.31%
Deposit rate – 3.25%

Although this should encourage spending with an increase in the money velocity in the circular flow some commentators are concerned that the Chinese authorities know something about their economy that the rest of world is in the dark about.

It is interesting to see the reaction of main central banks in the aftermath of the GFC and how aggressive they were in cutting rates – US, EU, UK – relative to the other countries on the graph, namely China, India and Australia. Furthermore notice that some economies seem to have been at a different part of the economic cycle namely Australia, India, and the EU as their central bank rates have risen in order to slow the economy down. This is especially in India as they have had strong contractionary measures in place but have now started to ease off on the cost of borrowing.

Indian growth has slowed to 5.3% this year and although this seems very healthy it is the lowest level in 7 years. A developing nation like this needs higher levels of growth to create the jobs for their vast working age population and without employment there could be a situation not unliike that of Spain where over 50% of those under 25 don’t have a job. The main cause of the slowdown seems to be from a lack of private investment.

Also look how low rates are in the US, UK, and EU. With little growth in these economies the policy instrument of lower interest rates has been ineffective and they are in a liquidity trap. Increases or decreases in the supply of money do not affect interest rates, as all wealth-holders believe interest rates have reached the floor. All increases in money supply are simply taken up in idle balances. Since interest rates do not alter, the level of expenditure in the economy is not affected. Hence, monetary policy in this situation is ineffective.

Asia’s energy source – bring on the negative externalities.

According to the International Energy Agency (IEA) coal accounts for 20% of the primary energy supply in OECD countries. If you consider world consumption, coal accounts for 50% of the increase in energy use between 2000-2010. Not surprisingly 66% of the growth in demand for energy has come from Asia with China leading the world in coal production and consumption – some interesting facts:

1. China mines over 3 billion tonnes of coal per year – that is x3 when compared to USA
2. 80% of China’s electricity comes from coal-fired power plants
3. Burning coal is the biggest cause of air pollution.
4. By 2030 China is likely to consume 4.4 billion tonnes of coal.
5. From 2005 – 2030 – Carbon emissions are expected to increase from 6.8bn – 15bn tonnes

India also uses significant amounts of coal – 70% of its electricity comes form coal. It has 5th largest coal reserves globally but cannot extract it quick enough to satisfy the demand. However its emissions will increase by 250% by 2030.

In the emerging Asian economies the drive for more coal-fired power continues to steam ahead. Unfortunately alternative forms of energy don’t offer affordable electricity on a large enough scale to satisfy the Asian economies insatiable demand for energy. Natural gas which emits less carbon could be an option, but it will not take over from coal. Look out for those negative externalities – see graph below from Tutor2u.net.

Ability to stimulate using Monetary and Fiscal Policy

With the stagnating growth levels in the developed world – USA, Europe, etc – the emerging economies are not immune from this environment. Lower export demand for goods and services impacts on average growth levels in those emerging countries. In order to get out this sluggish condition economies can employ both monetary and fiscal policy. However richer nations have tended to exhaust both these policy options by dropping interest rates to exteremely low levels (see interest rates below) and in their inability to exapand their borrowing because of the size of governmets deficits. Emerging economies average budget deficit 2% of GDP, against 8% in the G7 economies. And their general-government debt amounts on average to only 36% of GDP, compared with 119% of GDP in the rich world.

The Economist ranked 27 emerging economies according to their ability to utilise expansionary fiscal and monetary policy. They used 6 indicators to assess a country’s ability to use these policies. The first 1-5 focus on the ease of which countries can manipulate monetary policy interest rates. 6 concerns Fiscal Policy flexibility

1. Inflation – 2% in Taiwan to 20% or more in Argentina and Venezuela.
2. Excess Credit – measures the gap growth rate in bank credit and nominal GDP. Argentina, Brazil, Hong Kong and Turkey have seen credit grow vastly beyond GDP whilst Chinese bank lending is now rising mor slowly than GDP.
3. Real Interest Rates (interest rate – CPI) – tends to be negative in most economies. Over 2% in Brazil and China
4. Currency Movements (against US$ since mid-2011) – Nine countries, including Brazil, Hungary, India and Poland, have seen double-digit depreciations, with the risk that higher import prices could push up inflation.
5. Current-Account Balance – If global financial conditions tighten, it would be harder to finance a large current-account deficit, and so harder to cut interest rates.
6. Fiscal-Flexibility Index – combining government debt and the structural (ie, cyclically adjusted) budget deficit as a percentage of GDP.

From The Economist
The average of these monetary and fiscal measures produces our overall “wiggle-room index”. Countries are coloured in the chart according to our assessment of their ability to ease: “green” means it is safe to let out the throttle; “red” means the brakes need to stay on. The index offers a rough ranking of which economies are best placed to withstand another global downturn. It suggests that China, Indonesia and Saudi Arabia have the greatest capacity to use monetary and fiscal policies to support growth. Chile, Peru, Russia, Singapore and South Korea also get the green light.

Red alert
At the other extreme, Egypt, India and Poland have the least room for a stimulus. Argentina, Brazil, Hungary, Turkey, Pakistan and Vietnam are also in the red zone. Unfortunately, this suggests a mismatch. Some of the really big economies where growth has slowed quite sharply, such as Brazil and India, have less monetary and fiscal firepower than China, say, which has less urgent need to bolster growth. India’s Achilles heel is an overly lax fiscal policy and an uncomfortably high rate of inflation. The Reserve Bank of India has sensibly not yet reduced interest rates despite a weakening economy. In contrast, Brazil’s central bank has ignored the red light and reduced interest rates four times since last August. In its latest move on January 18th, the bank signalled more cuts ahead. That will support growth this year but at the risk of reigniting inflation in 2013. Desirable as it is to keep moving, ignoring red lights is risky.

World Income Inequality chart

Still on the inequality theme – here is a very worthwhile chart that looks at World Income Inequality. It is from the publication entitled “The Haves and the Have-Nots,” a new book by the World Bank economist Branko Milanovic about inequality around the world which was recently reviewed by New York Times columnist Catherine Rampbell. The graph below shows how inequality in Brazil, USA, China, and India ranks on a global scale. On the x axis the population of each country is divided into 20 equally-sized income groups, which is ranked by each country’s household income per person. These are referred to as ventiles and 1 ventile = 5% of the population. So that we are looking at purchasing power parity (PPP) the data is adjusted for the variance in the cost of living in different countries.

Now on the vertical axis, you can see where any given ventile from any country falls when compared to the entire population of the world.

Brazil
– poorest 5% are amongst the poorest in the world
– richest 5% are amongst the richest in the world

USA
– the bottom 5% are richer than 68% of the world’s population

India
– the bottom 5% = 4th poorest percentile worlwide.
– the richest 5% = 68th percentile worldwide which means that USA’s poorest = India’s richest.

Now you might be wondering: How can there be so many people in the world who make less than America’s poorest, many of whom make nothing each year? Remember that were looking at the entire bottom chunk of Americans, some of whom make as much as $6,700; that may be extremely poor by American standards, but that amounts to a relatively good standard of living in India, where about a quarter of the population lives on $1 a day.