New Zealand benefiting from high commodity prices.

New Zealand’s commodity prices have increased by 17% this year and is expected to increase by 22% by December 2021. What has caused this increase in prices? With Covid restrictions lifted in many countries this has seen an increase in demand especially from China and South East Asian countries. Dairy, horticulture and forestry commodity prices have been the big winners. Kiwi fruit returns are expected to be the highest on record and log prices have increase over 20% in the last 6 months. Furthermore with the opening up of restaurants in the northern hemisphere the demand for meat will undoubtedly increase which is a good omen for sheep and beef farmers. At this time of year lamb prices normally fall but prices have actually increased over April and May.

Shipping costs have been very high of late but as they start to come down with more supply this will be a further boost to exporters especially bulky exports like forestry. It is expected that wood export volumes will be approaching record high levels over 2021 and 2022. The strong return from commodity prices will mean higher national incomes and will support the strength of the NZ$ and interest rates.

This could be a honeymoon period for New Zealand exporters as supply will eventually catch-up with demand and bring down prices. From a longer-term perspective, environmental constraints are biting on global food production. New Zealand’s dairy sector is at the coal face and the demands by government for fencing and other environmental restrictions means that there is less land being used and lower stock numbers. Other dairy exporters in Europe are also experiencing the same restrictions and it is the consumer who is likely to bear the increase in costs with higher retail prices.

Source: Economic Overview. Reshaping the world. May 2021

Short-selling explained – ‘Trading Places’ movie

The 1983 movie ‘Trading Places’, staring Eddie Murphy and Dan Aykroyd tells the story of an upper class commodities broker Louis Winthorpe III (Aykroyd) and a homeless street hustler Billy Ray Valentine (Murphy) whose lives cross paths when they are unknowingly made part of an elaborate bet.

There is a great part in the movie when they are on the commodities trading floor that explains price and scarcity. Winthorpe and Valentine are up against the Duke Brothers in the Frozen Concentrated Orange Juice (FCOJ) futures market.

How a futures market works
As opposed to traditional stock/shares futures contracts can be sold even when the seller doesn’t hold any of the commodity. For instance a contract of $1.30 per pound for a 1000 pounds of FCOJ in February indicates that the seller is compelled to provide the produce at that time and the buyer is compelled to buy the produce.

Here’s how it worked in the movie

The Duke Brothers believe they have inside knowledge about the crop report for the orange harvest over the coming year. They are under the impression that the report will state the harvest will be down on expectations which will necessitate greater demand for stockpiling FCOJ – this will mean more demand and a higher price. Therefore at the start of trading the Dukes representative keeps buying FCOJ futures. Others saw they were only buying and wanted in on the action, those that had futures were not willing to sell so the price kept rising. However the report was fake and Winthorpe and Valentine had access to the genuine report which stated that the orange harvest had not been affected by adverse weather conditions. Knowing this they wait till the the price of FCOJ reaches $1.42 and start to sell future contracts.

Then when the crop report is announced and it indicates a good harvest investors sell their contracts and the price drops very quickly. The Dukes are unable to sell their overpriced contracts and are therefore obliged to buy millions of units of FCOJ at a price which exceeds greatly the price which they can sell them for. In the meantime Winthorpe and Valentine for every unit they sold at $1.42 they only have to pay $0.29 to buy it back to fulfill their obligation. This results in a profit of $1.13 per unit.

Gold prices – 9/11 to Qassem Suleimani

Over the years the store value of notes and coin hasn’t maintained its value like gold. Gold has been seen as a way to pass on the wealth of one generation to the next. What are some other reasons why gold goes up in price:

  • The US dollar is seen as the reserve currency and when its value drops there tends to be move towards buying gold as security and this ultimately increases its price. After the GFC of 2008 the price of an ounce of gold went from approximately $1,000 to $1,900.
  • Geopolitical uncertainty also sees people look to gold for relative safety – a good example was the drone strike that killed Qassem Suleimani, leader of the Quds Force of Iran’s Islamic Revolutionary Guard Corps. The price of gold rose around 3% one week after the event. The events of 9/11 saw gold rise by 6% – see Economist graphic.
  • Gold is also very prevalent in the culture of some countries. India is one of the largest gold-consuming countries and it mainly used for jewellery.

Below is a clip from the Corporation Documentary where commodities trader Carlton Brown gives his reaction on the trading floor when the events of September 11 were unfolding. He talks of the price of gold ‘exploding’.

The market for sand

Sand Demand.pngSand has become an integral part of the global economy and also the most extracted material. It is used in the construction industry where it is part of the process in making concrete and asphalt. Fine sand tends to be used to produce glass and electronics.

Demand
Since the GFC in 2008 Asian countries have been the big users of sand with China consuming up to 40% of world supply (Asia 70%) building 32.3m houses and 4.5m kilometers of road between 2011 and 2015. See graph from The Economist.

Although hard to believe, sand is becoming scarce as desert sand is too fine for most commercial purposes. Furthermore the cost of transporting sand can be very expensive in relation to the price and reserves need to be located near construction sites to make it more economical. By contrast Singapore and Qatar are big importers of sand to assist in their construction programme (especially the latter with the Football World Cup in 2022). Sand is also demanded to create more living area in a country. As is well documented, China has built fake island on coral reefs in the South China Sea. Japan has also claimed a lot of land by dumping vast amounts of sand.

Limited supply
Sand is being extracted at an increasing rate and this is having an impact on the environment  with water levels in lakes being lowered and beaches in resort areas of the Caribbean and northern Africa. Indonesia and Malaysia have now banned sand exports to Singapore as a result of thinning coastlines. But with limited supply comes a higher price and with a higher price the black market starts to become prevalent. In India the illicit market for sand is valued around $2.3bn a year. Also the rising price of sand will lead developing-country builders to source alternatives to sand

Sand – elastic in demand as there are substitutes:
*Sand could be classifies as elastic as there are substitutes:
*Mud can be used for reclamation
*Straw and wood to build houses
*Crushed rock to make concrete.

Global Outlook
With the continued growth of construction and manufacturing output global demand for sand is forecast to increase 5.5 percent to 291 million metric tons in 2018, with a value of $12.5 billion. Whether the supply can cope with this increase demand is another question. Higher prices will make illicit mining more attractive.

Sources: The Economist 1-4-17. Freedonia – World Industrial Silica Sand

‘Trading Places’ movie – short-selling explained

The 1983 movie ‘Trading Places’, staring Eddie Murphy and Dan Aykroyd tells the story of an upper class commodities broker Louis Winthorpe III (Aykroyd) and a homeless street hustler Billy Ray Valentine (Murphy) whose lives cross paths when they are unknowingly made part of an elaborate bet.

There is a great part in the movie when they are on the commodities trading floor that explains price and scarcity. Winthorpe and Valentine are up against the Duke Brothers in the Frozen Concentrated Orange Juice (FCOJ) futures market.

How a futures market works
As opposed to traditional stock/shares futures contracts can be sold even when the seller doesn’t hold any of the commodity. For instance a contract of $1.30 per pound for a 1000 pounds of FCOJ in February indicates that the seller is compelled to provide the produce at that time and the buyer is compelled to buy the produce.

Here’s how it worked in the movie

The Duke Brothers believe they have inside knowledge about the crop report for the orange harvest over the coming year. They are under the impression that the report will state the harvest will be down on expectations which will necessitate greater demand for stockpiling FCOJ – this will mean more demand and a higher price. Therefore at the start of trading the Dukes representative keeps buying FCOJ futures. Others saw they were only buying and wanted in on the action, those that had futures were not willing to sell so the price kept rising. However the report was fake and Winthorpe and Valentine had access to the genuine report which stated that the orange harvest had not been affected by adverse weather conditions. Knowing this they wait till the the price of FCOJ reaches $1.42 and start to sell future contracts.

Then when the crop report is announced and it indiates a good harvest investors sell their contracts and the price drops very quickly. The Dukes are unable to sell their overpriced contracts and are therefore obliged to buy millions of units of FCOJ at a price which exceeds greatly the price which they can sell them for. In the meantime Winthorpe and Valentine for every unit they sold at $1.42 they only have to pay $0.29 to buy it back to fulfill their obligation. This results in a profit of $1.13 per unit.

Sub-Sahara economies hit by fall in commodity prices.

Commodities have been the engine of growth for many sub-Saharan countries. Oil rich nations such as Nigeria, South Africa and Angola have accounted for over 50% of the region’s GDP whilst other resource-intensive countries such as Zambia, Ghana and Tanzania to a lesser extent.

I have mentioned the ‘resource curse’ in many postings since starting this blog. It affects economies like in sub-Sahara Africa which have a lot of natural resources – energy and minerals. The curse comes in two forms:

  • With high revenues from the sale of a resource, governments try and seek to control the assets and use the money to maintain a political monopoly.
  • This is where you find that from the sale of your important natural resource there is greater demand for your currency which in turn pushes up its value. This makes other exports less competitive so that when the natural resource runs out the economy has no other good/service to fall back on.

However it is the fall in commodity prices that is now hitting these countries that have, in the past, been plagued by the resource curse. As a lot of  commodities tend to be inelastic in demand so a drop in price means a fall in total revenue since the the proportionate drop in price is greater than the proportionate increase in quantity demanded.

The regional growth rate for 2016 is approximately 1.4% but it is not looking good for commodity driven economies:

  • Nigeria – oil – 2016 GDP = -2%
  • Angola – oil – 2016 GDP = 0%
  • South Africa – gold – 2016 GDP = 0%

In 2016 resource rich countries will only grow by 0.3% and commodity exporting countries have seen their exports to China fall by around 50% in 2015. Furthermore, public debt is mounting and exchange rates are falling adding to the cost of imports. With less export revenue the level of domestic consumption has also decreased.

It is a different story for the non-resource countries of sub-Sahara. It is estimated by the IMF that they will grow at 5.6%. By contrast they have been helped by falling oil prices which has reduced their import bill and public infrastructure spending which has increased consumption.

africa-oil-effectAs is pointed out by The Economist numbers should be read wearily as GDP figures are only ever a best guess, and the large informal economy in most African states makes the calculation even harder. Africa may have enormous natural reserves of resources, but so far most Africans haven’t felt the benefit. In Nigeria, for instance, what’s seen as a failure to spread the country’s oil wealth to the country’s poorest people has led to violent unrest. However, this economic paradox known as the resource curse has been paramount in Africa’s inability to benefit from resources. There is a gravitation towards the petroleum industry which drains other sectors of the economy, including agriculture and traditional industries, as well as increasing its reliance on imports. What is needed is diversification.

Commodity prices – supply and demand in action.

commoditiesThe Economist has a graph showing the change in price of commodities from 5th January 2016 to 18th October 2016. The change in price is purely reflected in simple supply and demand theory. In 2015 raw material price dropped mainly because of over-supply. The main points from the graph are:

  • Oil – $50 per barrel – expectations that supply might decrease by OPEC countries
  • Sugar – price up by 56% – unfavorable weather therefore supply decreases
  • Grain – prices down by 9% – bumper harvests in the USA
  • Beef – prices down by 24% – oversupply of beef


Commodity Currency – Aussie dollar overvalued.

Below is a video from the FT that I showed my A2 class this morning. The significance of it is the Australian dollar and how its value is strongly linked to iron ore prices. Recent growth in China has exceeded expectations and this has led to a rebound in commodity prices especially iron ore. The belief is the AUS$ is higher than the equilibrium level suggests and that this rate will not be sustainable. There are two reasons for this:

  1. Commodity prices have accelerated which has led to more demand for AUS$ which might not be sustained.
  2. Higher relative interest rates has made the AUS$ strong as ‘hot money’ has been attracted in the country. The Reserve Bank of Australia (central bank) has recently cut the cash rate (interest rates) to 1.75% and there is talk of a further cut this year.

Cyclical vs Structural

Below are some interesting graphs and comments from a recent ANZ Bank presentation which address the issue of unemployment.

Both cyclical and structural factors seem to have played an important role in the recent recession. From a cyclical point of view output and the unemployment rate of the economy reflect this and should recover to pre recession levels. Structural change involves the shift of resources from slower growing areas of the economy to faster growing areas. Indicators such as the savings rate and employment in the different sectors of an economy, seem to be driven more by structural changes and might not return to levels seen before the recent recession.

Economists spend a lot of time talking about the “cycle”, but this can be at the expense of the “trend”.

  • And isn’t it the trend that is more important for businesses?
  • We can get bogged down in the detail and forget about some of the high level themes that dominant
  • Often these trends or themes can be relatively clear. But a lot of the time they are not.
  • Arguably, today’s economic backdrop is one where there are more questions over the overarching trends than the cycle itself (although that is not that clear either!).

Structural Questions

Copper – Supply and Demand

The price of copper is on the up. Below are some Supply and Demand factors.

Supply curve shifts to the left.
Disruptions to production in
* Peru – protests
* Chile – strikes
* Zambia – power shortages

Demand curve shifts to the right
In the light of fast-modernising its power grid the demand for copper in China is vast.
“Copper consumption estimates for China are being revised up. Huge spending on copper-intensive power infrastructure on the state grid in ‘rural areas’ will continue through 2012 (12 bn RMB). Beijing has also renewed the ‘home appliance subsidy scheme’ and is promoting electric cars, which are twice as copper-intensive as conventional vehicles.” – Patricia Mohr, Economist, Scotiabank

Graph from The Economist.

Copper Price

Some commodity exporters doing okay with plunge in prices

CommodityThe recent drop in commodity prices has some economies very hard:

Russia – debt looks as if it is going to be downgraded to junk status
Venezuela – is on the verge of defaulting
Brazil – growth forecast cut
Norway – significant cut in government revenue

However some other commodity exporting countries are coping with this fall in prices. Chile and Peru which are dependent on metal exports are forecast to grow 3% and 5% respectively. Furthermore no Middle Eastern country is expected to enter a recessionary phase. The Economist identifies two factors that explain why some commodity exporters are coping better with lower commodity prices.

1. Business Friendly – Many countries have made their economies more business friendly – believe it or not according to the World Bank Rwanda is a better place to do business than Italy. Benign business environments encourage foreign direct investment – Africa has encouraged FDI despite the global economic conditions.

2. Prudent Government Spending
– when commodity prices were high and tax revenue was growing a lot of countries increased their expenditure significantly. However the opposite applied when prices fell as they no money to boost domestic demand.

As Keynes used to say – save when times are good and spend when times are bad.

Aussie v NZ – Iron Ore v Dairy

Both Australia and New Zealand face the worrying prospect of the impact of lower commodity prices. For Australia it is iron ore whilst across the Tasman it is the dairy industry. So how will each economy be affected by this?

NZ Dairy

The whole milk price has fallen from:

US$4999/tonne on 18th February 2014 to US$2270/tonne on the 16th December – a 54.6% decrease.

This downturn in prices will have a significant impact on the rural economy of NZ. The lower prices will not only reduce dairy farmers’ incomes, but there will be a knock on effect in other parts of the local economies as farmers and contractors will be less inclined to spend or invest in anything but necessities.

Short-term credit facilities will be able to help farmers with their costs but permanent lower returns would cause a rethink regarding production capacity and economies of scale.

Aussie Iron Ore

For Australian the iron ore prices have fallen from US$136 a tonne December 2013 to US$68 a tonne December 2014. This will have a major effect on their economy for the following reasons:

Iron ore represents 25.5% of exports from Australia
Iron ore producers are significant tax payers to the Australian Government. The drop in prices = AUS$18 billion loss of revenue
Lower prices mean less investment in capital – this sector has been a major part of the Aussie economy over the last few years

Who will take the biggest hit?

It is expected that Aussie will take the biggest hit mainly because of the tax revenue lost through lower iron ore prices. In NZ dairy farmers are not big tax payers and the NZ government are not expecting a big fall in tax revenue. Furthermore overall economic activity is largely unaffected as milk production is likely to continue in the short-term. However the falling unemployment rate in NZ and a rising level in its Trans Tasman neighbours suggests NZ is in a much better state to weather the storm. Other indicators below favour NZ. These include GDP growth and consumer confidence as well as having the ammunition of being able to cut interest rates further, a situation that Australia might find difficult.

Aus v NZ Commod


Source: NZ Herald December 20, 2014

Commodity prices drop but Aussie dollar holds firm

Aus dollar Commod PricesSince the Aussie dollar was floated in 1983 its value closely followed that of its commodity exports – see graph from The Economist. However since 2003 commodity prices have increased 400% but the dollar rose by much less and no longer had a direct relationship to commodity prices. There are 3 possible reasons for this:

1. The deregulation of financial markets which facilitates the ease of currency trading
2. The current account deficit in Australia which got to 6.2% of GDP in 2007
3. Interest rates in Australia up to the GFC were realtively low compared to other developed countries

2011 saw commodity prices drop but the Aussie dollar has remained strong. As most economies employed a lose monetary policy and proceeded to drop interest rates aggressively after the GFC, the Aussie economy didn’t in fact go through a recession and its interest rates remained relatively strong – see below.

CB Interest Rate Nov 13

Although a weaker exchange rate could help the Aussie economy especially as it has been susceptible to the resource curse – the strength of the exchange rate and higher interest rates is already putting pressure on some industries, particularly the tourism, manufacturing, education exports and retail industries.

Kevin Slavin: How algorithms shape our world

Although I have mentioned this TED talk on a previous post – The Fear Index – I thought it deserves a separate post for people to view the presentation.

Kevin Slavin argues that we’re living in a world designed for — and increasingly controlled by — algorithms. In this riveting talk from TEDGlobal, he shows how these complex computer programs determine: espionage tactics, stock prices, movie scripts, and architecture. And he warns that we are writing code we can’t understand, with implications we can’t control.

Gold Prices, Google Searches and S&P Volatility Index

Well, I didn’t get sunburnt after 3 weeks at the beach, however it was good to get away.

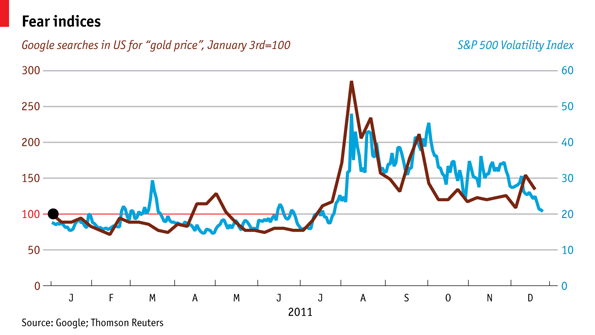
Below is a chart from a series that The Economist produced entitled Charting 2011. It shows the correlation between google searches in the US for the “Gold Price” and the “S&P 500 Volatility Index”.

Often referred to as the fear index or the fear gauge, the S&P 500 Volatility Index (VIX) represents one measure of the market’s expectation of stock market volatility over the next 30 day period. It is quoted in percentage points and translates, roughly, to the expected movement in the S&P 500 index over the next 30-day period, which is then annualized. Wikipedia

However it is interesting to relate the above chart to that of the actual gold price for 2011 – see below. Here we can see that there is a reasonable correlation between the actual gold price and the google searches and the VIX. Gold prices rose once again from the turbulence on world markets and recorded its 11th straight gain. Will gold prices continue to rise? The fundamentals that have pushed up the price of gold are still evident, namely:

– the problems of debt within the eurozone
– the concern of a double dip recession in a lot of the larger economies
– the increasing demand for gold jewelry amongst the developing economies such as India and China.

How Banks cause hunger

Here is a great graphic that shows how banks and other financial speculators are betting food prices in financial markets, causing dramatic spikes in the cost of food. This infographic done with the World Development Movement, looks at how higher prices for staple foods, such as wheat and maize, mean poor people around the world are going hungry and millions are being forced into deeper poverty. Click here to go the infographic site.

Developing economies – barriers to trade

In teaching my AS level class Unit 4 -Trade – of the CIE course I have often used the Black Gold DVD which shows some good examples of barriers to trade. The part of the DVD that is particularly relevant is at the World Trade Organisation (WTO) talks in Cancun, Mexico in 2003.

In countries such as Ethiopia, small coffee producers have suffered as a result of the WTO. The International Monetary Fund (IMF) and the World Bank, established to facilitate global trade and regulate an international monetary system, have privatised public businesses and removed restrictions on foreign ownership in many developing countries who sign the IMF agreements in order to prevent default on international loans. Black Gold – The Economics of Coffee

Furthermore, as the farming sector in developed countries continues to get government subsidies – $300bn pre year – the IMF insisted that those developing countries receiving IMF aid had to stop any assistance to their own farmers. One wonders how these countries are going to achieve any sort of growth as subsidies wipes out the ability of developing countries competing on the international market. At the WTO in Cancun, ministers from across Africa packed out the conference centre calling for an end to subsidies. As Sam Mpsau the Minister of Commerce and Industry in Malawi stated:

“we would like the world trading system to be able to help us stand on our own two feet. Trade is more important to us than aid. We cannot live on aid forever”.

A 1% increase in the continent’s share of world trade would in itself generate $70 billion per year – five times more than what the continent now receives in aid.

Below is a trailer to the movie. Well worth getting.

Oil prices↓ and ¥↑?

With the terrible events overnight in Japan one wonders how the Japanese economy is going to be affected. However it was interesting to notice what has happened to the Yen against the US$ and the price of oil.

The US$ dropped against the Yen – was ¥82.8 but now is ¥81.8. Reasons for this:
1. The flow of insurance pay-outs that will no doubt follow the earthquake/tsunami.
2. Companies repatriating funds as happened after the Kobe earthquake in 1995

Benchmark Brent crude oil contracts fell 1.1 per cent to $114.16. Reasons for this:
1. The closure of Japan’s refineries damped immediate demand for crude oil.
2. Considering Japan’s huge oil consumption, around 4.4 million barrels a day, investors feared the demand would fall after the disaster at least temporarily, triggering large scale of sell-offs across markets.

According to the FT in London:
Natural disasters can actually be positive for growth because governments spend to repair the damage. After the Kobe earthquake in 1995, the Nikkei fell about 8 per cent in the following five days, then recovered 5 per cent in the next two weeks.

In a broader sense this earthquake is probably the last thing that the Japanese economy needed – namely its ability to pay in order to get the country back to a growing level of economic activity. However, although Japan’s government is highly indebted its people are very wealthy and there are many ways that you can tap into this wealth.

It seems that oil prices will be downward until the damage in Japan is fully assessed. But there always remains the threat of further political turmoil (sorry about the pun) in the Middle Eastern countries.

Libya and world oil

In 2008, at the height of the financial crisis, a barrel of oil reached $147 and amidst the turmoil in the Middle East there are concerns that this figure will reach over $200 a barrel. If this transpires there is a real risk of a double-dib recession especially in the US and Europe – if not New Zealand. In Libya, as rebels took control of the port of Tripoli its critical oil supplies remained squeezed, production from most of Libya’s oil fields was down to very low levels. The country’s wealth largely comes from oil and whoever controls the oil fields will ulitmately control the country.

Libya in the Global Oil Market

The Economist website has some good statistics about the oil industry. Libya sends 1.4m barrels/day to global markets which is around 2% of global demand. This makes Libya the thirteenth largest oil exporter. Saudi Arabia the worlds biggest exporter, and country with significant spare capacity, is already pumping an extra 600,000 barrels per day to make up for the shortage on world markets.

A recovering global economy had convinced traders that demand for oil was going to rise by about 2 percent in 2011. Some industry experts and Wall Street visionaries were predicting a gradual return to $120 and even $150. The thinking was that investors would pour money into the commodity markets. This was due to the huge increase in demand from developing countries which was threatening to obliterate OPEC’s spare capacity – see graph below.

If prices keep climbing, consumers will in all likelihood tighten their belts. If prices stay high for long, the impact could be severe: every oil shock of the past 40 years has helped push the global economy into recession. Nariman Behravesh, senior economist at IHS Global Insight, said that every $10 increase in the price of a barrel of oil reduces economic growth by two-tenths of a percentage point after one year and a full percentage point over two years – New York Times.

However, as the world is so dependent on oil there is little room for supply disruptions. Spare capacity is at 5 million barrels a day which is approximately 6% of what the world consumes every day. Although this is 4% higher than in 2008 it is still worringly low when one considers the demand pressures coming from developing countries like China and India. However that is not even taking into account the loss of about one million barrels a day exported from Libya. If Libyan oil was to be removed from the oil market it would represent the 8th largest oil shock in history – see graph below.
Much now hinges on what happens next in the Middle East. The price spikes that accompanied the two Persian Gulf wars did not have deep impacts because of they did not last long enough. But several oil price increases have preceded economic downturns. The biggest shock followed the 1973-74 OPEC embargo, which quadrupled oil prices and helped produce stagflation, a period of slow growth, high unemployment and inflation. The 1979 Iranian revolution caused another shortage, and again American motorists were forced to wait in long lines for gasoline. Oil prices surged, but they did not stay elevated for long, as Mexico, Nigeria and Venezuela expanded production and OPEC lost its unity. Oil prices remained low for years, and the economy through the later half of the 1980s and most of the 1990s was generally strong. New York Times

Copper – record price


Demand
Demand for copper and other industrial metals is outstripping supply, as industrial output by the emerging markets economies surges ahead of their pre-recession levels. China’s unrelenting demand being an important factor.

Supply

Global copper inventories are down by about a third this year, and traders say that with supplies so tight, the risk is that prices could rise more rapidly if the recovery gathers pace. The major exception to this trend is China, which is sitting on a large stockpile that it built up during 2009, but is expected to be used up during the coming months. Prices in dollars have also been supported by the relative weakness of the US currency, compared with the euro and particularly the Chinese yuan.

Copper prices record high $9,660 a tonne on the London Metal Exchange and near all-time peak of $4.44520 per lb on New York’s COMEX market.