Why is demand still strong with contractionary monetary policy?

Double-digit inflation and aggressive tightening by central banks has been the order of the day in the global economy, however consumer spending still remains robust especially in the more elastic (luxury) goods and services market. Events like Beyoncé concert in Stockholm increased the inflation rate in Sweden – see here for previous post. As well as concerts, tourist activity has also been back to pre-COVID levels, so why has consumer demand held up when monetary conditions are very tight i.e. high interest rates.

  1. The labour market remains very strong with low unemployment and strong wage growth.
  2. The COVID times saw stimulus payments to consumers who were unable to spend their money therefore accumulated savings. This money is now finding its way into the circular flow.
  3. A decade of low interest rates has led to greater liquidity and consumer spending.
  4. Mortgage payments are the biggest debt that households but the rapid increase in interest rates has had less of a profound effect especially in the euro area. The ECB has risen interest rates by 4% (-0.5% – 3.5%) since late last year but the average rate for a mortgage is 2.19%.
  5. Mortgage holders are now favouring a fixed term for their loan so they are only impacted when they have to refinance existing loans.
  6. Households and firms are still optimistic about the future and continue to spend and borrow.
  7. The boom in property prices since the GFC has meant a lot of younger people have been pushed out of the market and rent accommodation – see graph. The dominance of young people in the rental market is driven by both circumstances (such as an inability to afford a down-payment to buy a home, or to qualify for a mortgage) as well as choice (due, for instance, to the greater flexibility of renting relative to owning). The higher average age of homeowners has led to more that are mortgage free.

However as is the case with monetary policy there is the pipeline effect a time lag for the impact of higher rates to reduce spending and therefore can be inappropriate. Sometimes instead of offsetting the effects of the business cycle this policy might reinforce the business cycle rather than acting counter-cyclically. Until then the consumer is still keen to spend whether it be travel, concerts or the latest fashions.

Source: OECD

Sign up to elearneconomics for comprehensive key notes with coloured illustrations, flash cards, written answers and multiple-choice tests on Inflation that provides for users with different learning styles working at their own pace (anywhere at any time).

Chinese property, the output approach and triple counting

Over the last couple of decades property has been a significant driver of Chinese growth. The dependence on real estate is shown below and it is interesting to note that China was more dependent on housing construction than Ireland and Spain prior to the Global Financial Crisis.

Real estate related activities’ share of GDP by country, 1997-2017

Source: Rogoff and Yang

Real estate has impacted consumer spending, employment of workers, investment and demand for raw materials. Investment in property has increased by 5% of GDP in 1995 to 13% in 2019 – 70% of which was residential. As for household consumption 23% is spent on real estate. How do you work out the value of output for residential investment and is there a problem with double counting?

GDP and the Output Approach

Gross domestic product (GDP) is defined as the value of output produced within the domestic boundaries of a country over a given period of time, usually a year. It includes the output of foreign owned firms that are located in that country, such as the majority of trading banks in the market. It does not include output of firms that are located abroad. There are three ways of calculating the value of GDP all of which should sum to the same amount since by identity:

NATIONAL OUTPUT = NATIONAL INCOME = NATIONAL EXPENDITURE

The output approach is the value of output produced by each of the productive sectors in the economy (primary, secondary and tertiary) using the concept of value added.

Value added is the increase in the value of a product at each successive stage of the production process. For example, if the raw materials and components used to make a car cost $16,000 and the final selling price of the car is $20,000, then the value added from the production process is $4,000. We use this approach to avoid the problems of double-counting the value of intermediate inputs. GDP will, therefore, be equal to the sum of each individual producer’s value added.

The Economist look at a simple example of calculating the output approach using a house. House is built and makes up the whole economy. It is made of steel which is made from iron ore.

House is sold – $1m
Steel is sold – $600,000
Iron ore is sold – $500,00

How significant is the construction industry? As the builders add $400,000 to the value – 40% of GDP. But if the whole economy is the house is it 100% as the iron ore is an ingredient of the steel that is bought by the builder.

The Economist mention a paper by Kenneth Rogoff and Yuanchen Yang “Has China’s Housing Production Peaked?” in which they take a different view on calculating the value of property. They use the input-output total requirement matrix with the economy divided into 17 industries – manufacture of machinery, construction, transport etc. The coefficients indicate the production required directly and indirectly in each sector when the final demand for domestic production increases by one unit. By adding up the coefficients corresponding to the construction industry they found that 1 unit of increase in the construction sector requires 2.12 units of inputs from forward (other contractors) and backward (raw materials) industries. In breaking down the construction and installation as part of Chinese real estate, investment is RMB 7,630 bn. Thus 2.12 x 7,630 = RMB 16,176 which is the total value.

Therefore in the original option the Rogoff and Yang model would include the iron ore and not the value of the house or the $400,000 value added by the construction industry. Therefore:

Steel $600,000 + Iron ore $500,00 – $1.1m

There way of removing double counting is unusual as if you add the construction output $1m, steel output $600,000 and iron ore output $500,000 there is a double and triple counting:

x2 = Steel – counted twice – purchase of steel and when house is sold
x3 = Iron ore – counted three times – purchased in raw material form, when used to produce steel and when house is sold.

The way that is normally talked about in textbooks is to only count the added value at each stage of production. Iron ore $500,000 + steel $100,000 + $400,000 construction costs – $1m = 100% of GDP in a one-house economy.

Sources:
China & World Economy / 1–31, Vol. 29, No. 1, 2021. Has China’s Housing Production Peaked? Kenne
th Rogoff, Yuanchen Yang

The Economist: Free Exchange – A universe of worry. November 27th 2021

Sign up to elearneconomics for comprehensive key notes with coloured illustrations, flash cards, written answers and multiple-choice tests on National Income accounting that provides for users with different learning styles working at their own pace (anywhere at any time).

Housing affordability in New Zealand

I blogged on this topic earlier in the year and found it interesting that although mortgage repayments have become more affordable it is the deposits which people find hard to muster mainly due to the significant increase in house prices over the years. Below is an informative graphic about housing affordability in New Zealand.

Over the last 20 years mortgages have become much more affordable even with the increase in house prices mainly due to lower interest rates. Remember even though house prices were lower 20 years ago the interest payments were much higher. Today we have seen much lower interest rates and higher house prices but it also should be noted that the banks have got much more flexible mortgage plans that allow buyers to spread payments over many years which means lower weekly payments.
*Mortgage affordability is measured by the weekly cost of servicing a two year fixed rate mortgage at a normal house price compared to the change in median income.

Deposit affordability is key
Note that it is the deposit which is much less affordable but the mortgage payments are much more affordable. It is twice as hard to get a deposit on a house on a median income than it was 20 years ago. Therefore those that can muster a deposit find the repayments very affordable. The increase in house prices has become a major problem to those trying to muster a deposit – higher house price = higher deposit. Therefore unless incomes rise with house prices deposit affordability becomes out of reach for many.

Source: WSBG Commerce Teachers’ Professional Development Day 2021

“New Zealand housing market: the importance of interest rates and urban land supply”, Dominick Stephens, Deputy Secretary, Chief Economic Advisor at The Treasury

Auckland vs Canterbury and house affordability

Earlier this year the Demographia International Housing Affordability Survey was published covering 309 metropolitan housing markets in eight countries including New Zealand. The survey rates middle-income housing affordability using the “Median Multiple,” which is the median house price divided by the median household income. The Median Multiple is widely used for evaluating housing markets.

Source: ASB Bank

Although houses are more affordable in Canterbury than in Auckland they are still in the classification of severely unaffordable according to Demographia International Housing Affordability Survey. The 5.1 still compares favourably to the national average of 7.5 and Auckland’s 9.5. According to the ASB house price forecasts Auckland house prices exceed ten times median incomes (chart below).

Some other points to note internationally are that among all markets:

  • 54 are affordable (Median Multiple of 3.0 or less) they are in Australia (1), Canada (8), Ireland (1), and the United States (44).
  • No affordable markets in China (Hong Kong), New Zealand, Singapore or the United Kingdom.
Source: 16th Annual Demographia International Housing Affordability Survey: 2020 Rating Middle-Income Housing Affordability

Why are house prices on the rise in New Zealand?

The rise in house prices in New Zealand has been against all expectations. Four indicators tend to have the biggest impact on house prices:

Lower interest rates seem to be the main reason for the major increase in prices but there is fear amongst consumers if they don’t purchase a property now they will miss out on the market as prices start to escalate. With interest rates being predicted to remain low for till at least the end of next year it is likely that house prices will remain elevated with no major correction. However as with most housing markets there will become a time when over-zealous investors push prices to non-sustainable levels. If house price to income and rent ratios blow out then owning a house will simply become an untenable option for a greater proportion of the population. Ultimately, prices will then have to move. Below is a useful graph showing house prices in New Zealand since 1963 – generally on the up for the vast majority of the period.

Source: RESEARCH ECONOMY WATCH – BNZ 15th October 2020

Auckland house prices 73.8% overvalued against income.

Whilst there has been a lot of talk about Auckland’s flattening house prices the city is ranked only behind Hong Kong (94.1%) as the most unaffordable city in the Economist’s ‘cities house price index’ – house prices in Auckland are 73.8% overvalued compared to the average income. This figure is ahead of Sydney, Amsterdam, London, New York, Paris and Vancouver – see graph from The Economist – showing how housing is basically unaffordable in proportion to earnings.

There are 3 reasons why house prices globally have been accelerating at such a high rate – Demand, Supply and the cost of borrowing.

Demand
Regional population growth in Auckland has been significant and although is slowing it still has the fastest population growth in NZ. With the influx of people and the housing construction more jobs become available which in turn attracts workers from other areas. Furthermore foreign investors have played their part in increasing demand although this has reduced over the last year with the government putting in place regulations with home ownership.

Supply
Housing has become particularly scarce with supply unable to keep up with demand. But recent consent figures for 2018 show that 13,000 were issued in Auckland compared to 10,000 in 2017. Auckland was previously building too few houses relative to population growth, leading to a worsening housing shortage as indicated by a rise in the estimated number of people per dwelling.

Low interest rates
Since the GFC economics has been dominated by fiscal and monetary policies to stimulate aggregate demand. Tax cuts have added to consumers bank balances but it is monetary policy that has been particularly prevalent with record low interest rates encouraging consumers to borrow money and buy property. Furthermore with the stock market becoming a fickle location for investment investors sought the so-called safety of the housing market and in many cities did particularly well.

But prices are starting to level off and in some cities falling in a response to variety of reasons – rising  yield on treasury bonds – tighter regulations on overseas buyers – uncertainty about Brexit – China tightening up on capital outflows of the super-rich.

Source: The Economist – Buttonwood – November 10th 2018

New Zealand Household Debt

Household debt in New Zealand is now equivalent to 163% of annual household disposable income – see graph below. Record low interest rates has seen credit growth rising at a pace not seen since 2008. How do low interest rates contribute to this?

Household debt as a share of disposable income (including investment housing)

house-debt-dis-inc

Low borrowing rates have made it easier to purchase property with bank funds especially as the supply of housing hasn’t matched the increase in demand. The strong growth in property prices has meant that those who already own a house are using that security to purchase additional property. According to the IMF New Zealand has the highest ‘House Price-to-Income Ratio’ – see graph below.

house-price-income-ratio

Other parts of the world are experiencing high household-debt to income levels (see graph below) but does high debt levels mean that the economy is going to hit a major recession? Since the credit crisis of 2008 the global financial system has seen tighter regulations put in place to improve stability with banks limiting access to credit so there is less exposure to the risks associated with highly leverage lending.

Growth in house prices and household credit 2011 – 2015.

house-prices-household-credit

However debt servicing remains tolerable with low interest rates and much of the debt secured against investment housing. Also debt-to-asset ratios have fallen to levels that were experienced in 2007 but this has eventuated from low interest rates which have boosted house prices. Ultimately with a fall in house prices, and depending on its severity, those who recently entered the property market would suffer some degree of hardship whilst those already well established in the market might have a financial  buffer.

Debt and future growth in New Zealand

Household debt still has implications for the long-term growth of the economy.

  1. With larger proportions of their income being allocated to debt consumers have less disposable income for other goods and services which creates less aggregate demand.
  2. High debt levels mean households have more exposure to unfavorable economic conditions that could lead to rising unemployment. In this case they have less money to fall back on.

Source: Westpac Economics Overview – August 2016

Housing bubble and zero sum game

There has been a lot of talk in the media about an Auckland housing bubble and its impact on the New Zealand economy.  Below is a very informative graph I got from http://www.housepricecrash.co.uk which looks at the anatomy of a bubble.

Anatomy of bubble

Zero-Sum Game

When house prices are increasing rapidly we tend to feel better off but also have increased mortgage debt. House price inflation is a zero-sum game in that society as a whole does not benefit from a rise in house prices as those on the property ladder can only gain at the expense of prospective homeowners that cannot afford to enter the market. Over a short period of time house price inflation can provide a boost to economic growth if they deceive people into believing they are wealthier.

Positive-Sum Game

However, when a business invests it tends to have a positive-sum game in that if it employs 50 more workers that doesn’t mean that there are 50 other workers in the economy that are going to lose their jobs. This is real GDP growth rather than investing in property which tends not to generate growth as it is a finished asset – however some will argue that maintenance will always be needed.

House price inflation: Ireland v New Zealand

Brian Gaynor wrote a piece in the NZ Herald comparing features of the Irish and New Zealand economies. One area that he focused on was the increase in residential property prices from 1995 – 2015.

Ireland – 199%
New Zealand – 232%

Although New Zealand house prices have been increased by a larger percentage it is interesting to note that they have been relatively steady whereas Irish prices peaked in mid-2007 and then plunged 50% by early 2013. Since then they have recovered 31% but are still 35% below their highs in 2007.

Dublin house prices (average) – 2007 = $730,000 2015 = $485,000
Auckland house prices (average) – 2015 = $771,000

LTV – Loan to Value

Like the RBNZ the Irish central bank has introduced new regulations regarding mortgage lending by regulated financial services providers. These included mortgages of no more than 80 per cent of LTV (loan to value) on the principal private dwelling and no more than 70 per cent LTV on investment properties. Additionally mortgage loans on the principal private dwelling are restricted to 3.5 times gross income in Ireland but this ratio in New Zealand is 6 times although 9 times gross income in Auckland.

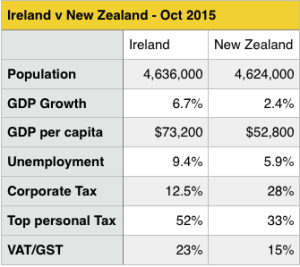
Ire v NZTax Policy
The two countries tax policy are interesting when you compare how they impact companies and individuals. The message for the New Zealand economy is that the experience of the Irish economy shows that countries take a long time to recover from the impact of housing collapse.

Danish Mortgages – Levelheads v Woodheads

An interesting paper* by the Harvard Economics Department looked at the Danish mortgage market and the fact that people tend to ignore the chance to save money when they can refinance their mortgage at any time without incurring a penalty. They identify those that are attentive to mortgage market changes and refinance their mortgage as ‘levelheads’. On the contrary those that are inattentive and experience inertia are seen as ‘woodheads’

The researchers found that many household characteristics move inertia and inattention in the same direction, so these attributes are positively correlated across households. Younger, better educated, and higher-income households have less inertia and less inattention. Almost three times as many homeowners refinanced in 2010, after rates had fallen sharply, than in 2011 when interest rates briefly spiked higher again. But woodheads were prevalent in 2010 as only 44% of those with a mortgage rate of more than 6% refinanced their loans even though rates of nearly 4% were available. On average woodsheds paid an extra 1.5% of interest as a result of their lethargic attitude.

The figure below illustrates the history of refinancing activity in our sample of Danish fixed-rate mortgages. In each plot, the bars (left vertical axis) represent the number of refinancing households, while the solid line (right vertical axis) shows the history of the mortgage interest rate. The top panel shades each of the bars according to the coupon rate on the old mortgage from which households refinance. The bottom panel shades each of the bars according to the coupon rate on the new mortgage into which households refinance.

*“Inattention and Inertia in Household Finance: Evidence from the Danish Mortgage Market” by Andersen S, Campbell JY, Meisner-Nielsen K, Ramadorai T. 2015

Danish Mortgage Refinancing

Unaffordable Housing Markets

House PricesHere is a graphic from The Economist showing the least affordable houses globally.The Survey from Demographia ranks urban housing markets into four categories based on their Median Multiple, from “Affordable” (3.0 or less) to “Severely Unaffordable” (5.1 & Over)

Severely unaffordable markets are also more attractive to buyers seeking extraordinary returns on investment and short term profits. This further raises prices in markets where urban fringe development is largely prohibited by urban containment’s land rationing policies. Substantial international investor activity has been reported in London, Vancouver, the US West Coast markets of Vancouver, Seattle, the San Francisco Bay Area, Los Angeles and San Diego and others. These price increases make such metropolitan areas less livable for average and lower income households.

The key to preserving housing affordability is a “competitive land supply,” which appears to be incompatible with urban containment policy both in economic theory and practice. Further, out-of-control house price escalation destabilizes economies, retarding metropolitan area economic growth and job creation.

Global Housing affordability

The distribution of housing affordability in the 85 major metropolitan markets (those with more than 1,000,000 residents) has deteriorated over the past year – see graphs.

Countries
Hong Kong is least affordable followed by Australia and New Zealand.

Cities
Hong Kong – least affordable, with a Median Multiple of 14.9
Auckland – Multiple of 8.4
London – Multiple of 7.3

Source: 10th Annual Demographia International Housing Affordability: Survey: 2014

Housing afforability countries

Housing affordability cities

NZ household deleveraging – will it last?

New Zealand households have gone through a period of deleveraging since the GFC in 2007 in which borrowing against the house has dropped significantly. Consequently household savings has gone up. However the increase in household debt from 2000 to 2007 was rapid and is forecast to increase further especially with house price inflation on the rise. But this house inflation doesn’t correlate to the economic conditions of the country and RBNZ Governor can be justified in saying that house prices are over-valued. Graph below from the BNZ Economy Watch.

Debt to disposable income

Housing boom in Auckland – repeat of US housing market collapse?

On New Zealand’s TVONE last night the current affairs programme “Sunday” ran a segment on the booming property market in Auckland. There were some interesting interviews with real estate people plus economists – namely BNZ Chief Economist Tony Alexander and New Zealand Institute of Economic Research (NZIER) Principal Economist Shamubeel Eaqub. The economists were a lot more rational in their thoughts as to buying a house – for example:

* Have you actually done the sums?
* Can you afford to repay the mortgage if there is a 3% interest rate increase?
* We could see a US style housing collapse.
* Auctions are a good example of buying on emotion with all the hype.

Loads of behavioural economics in the programme. You should be able to see the following:

Herding – People tend to follow the herd, especially information is uncertain, incomplete, and asymmetric (some people are more informed than others).

Relative Positioning – is a concern people have regarding their own economic and social status relative to other people.

Overconfidence – is a belief, fed by emotions, that you can predict movements better than you actually can. When you’re overconfident, you’re not as smart as you think you are.

Institutional Failure – Investment decisions that can be bad for society but good for the individual can be a product of the institutional environment. If decision makers face little or no downside risk when making very risky decisions, they’ll take those risks.

Here is the link to the programme – “Sunday – Going, Going, Going”

House Prices

Productive debt – Agriculture not Housing

Brian Gaynor in the Saturday NZ Herald reinforced the belief that borrowing in New Zealand must be in an area that is going to generate growth. He presented the lending figures over the last 10 years for Agriculture, Business and Individuals and made the following points:

1. Export revenue from agriculture has increased from $7.3bn in 2001/02 to $16.7bn 2011/12.
2. Agricultural debt has made a positive contribution to the economy
3. There are very limited benefits of $102.7bn of residential mortgage debt over the past ten years.
4. Additional individual borrowings have been mainly used to push up prices of existing houses, rather than building new homes
5. Additional debt has to be shifted away from existing housing and into the productive sector – agriculture and house construction
6. The government needs to develop policies with regard to overseas ownership of land.

New Zealand has the potential to be the bread basket of the Asia Pacific region and the financial returns to the economy are significant. However there has to be an increase in investment and lending to the agricultural sector if it is to be successful.

Second Housing Bubble in the US?

Here is a clip from PBS with Robert Shiller (Yale Professor and co-author of the book Animal Spirits which reasserts the necessity of an active government role in economic policymaking). The US economy maybe showing signs of a slow recovery but the housing market is still subdued. New data released yesterday showed a weak housing market. The S&P-Case-Shiller (named after the forementioned) home price index of 20 leading cities found that prices fell in January, for the sixth month in a row. The index is down nearly a third from its peak in 2006, before the housing bubble burst. And it’s just 1 percent above its low in 2009. Why hasn’t very low interest rates and low house prices attracted people into the market? – listen to Robert Shiller. It seems that the US housing market still has not bottomed out and, with high levels of unemployment and the memory of the last housing bubble, there is a wait and see attitude.

Build a hotel in 6 days! China’s housing bubble?

This week The Economist had a good article on the Chinese housing market. It seems that the biggest concern is the massive increase in the potential supply of housing. Barclays Capital have indicated that 40% of the skyscrapers due for completion in the next 6 years will be in China, increasing the number of tall buildings in Chinese cities by more than half. To give you an idea of the speed that the Chinese work at, a 15 storey prefabricated hotel in Changsha was erected in just 6 days – see below.

Within China incomes have mirrored increases in house prices (interesting to note Australia and New Zealand on this graph) but in the bigger cities this has not been the case and the recent IMF report suggested that “city prices appear to be increasingly disconnected from fundamentals”. In order to put try and quell house prices the Chinese government have done the following:
* first homebuyers need a 30% deposit as a downpayment
* if you buy a third or subsequent home you will not be able to get a mortgage.

With all this supply you need to have demand which in most countries often comes in the form of speculative investors looking for a capital gain. The government has been trying to restrict this practice by the following:
* restricting mortgages taken out for investment purposes
* banning state owned enterprises from buying land
* banks have to put money into an account that is held by a third party and is only released at certain milestones – known as escrow accounts
* for developers downpayments are now 60-70% of the land’s value

However this has led some developers to borrow money from offshore and restrictions or rules are open to corruption especially in the smaller cities.

Nevertheless, these efforts by the government have had some success with house inflation running at 6.4% – the CPI in China rose 4.9 percent year on year in January 2011. And its exposure to mortgages and loans are not at the levels seen in developed countries. According to the IMF, mortgages accounted for 20% of outstanding loans in Chinese banks. This is compared with 52% in Hong Kong and 57% in the USA. But The Economist argues that mortgage debt is rising from a low base; and a property bust could spillover into other fields to which banks have lots of exposure.