Are four-day working weeks the future?

There has much debate around the benefits of the four-day working week for both employees and employers. Research which was co-ordinated by a not-for-profit organisation, 4 Day Week Global, with employers in Ireland, the United States, Australia and New Zealand taking part. The UK had the biggest single-country trial in 2022 (Covid-19) which involved 73 companies and 3,300 employees. The Statista graphic below shows the results of the study which mainly focuses on productivity.

Why do economies put significant emphasis on boosting productivity?

  • Higher wages – with greater output per unit of input firms can offset the effect of wage increase on profits.
  • Lower prices – with productivity increasing businesses can pass on lower prices to consumers, although whether this actually happens is another story.
  • Higher profits – with productivity going up businesses can increase in their profits which means more money can be reinvested into the firm
  • Higher potential growth – higher productivity is the main driver of living standards and shifting the production possibility curve (PPC) outwards.

Other data from the research

  • Declining levels of stress, burnout and general fatigue
  • Better physical and mental health and work-life balance
  • Although some still worked on their day off, most felt more productive
  • Greater levels of exercise and sleep
  • Male workers spent more time looking after their children – up by 27%.
  • One less day at work meant less commuting time and therefore less environmental impact

Juliet Schor, an economist and sociologist at Boston College and lead researcher at 4 Day Week Global argues that a shorter working week is key to achieving the carbon emissions reductions the world needs. Click here to listen to her interview on the IMF podcast series ‘Women in Economics” Juliet Schor on the Benefits of the 4-day week.


Although climate benefits are the most challenging thing to measure, we have a lot of research showing that over time, as countries reduce hours of work, their carbon emissions fall. A 10% reduction in hours is associated to an 8.6% fall in carbon footprint” according to a study co-authored by Schor in 2012

Source: Four-day work week trial in Spain leads to healthier workers, less pollution. WEF. Oct 25, 2023

For more on the Labour Market view the key notes (accompanied by fully coloured diagrams/models) on elearneconomics that will assist students to understand concepts and terms for external examinations, assignments or topic tests.

Tiger Woods and the backward bending supply curve of labour

Tiger Woods was in the news recently with the ending of his relationship with the apparel company ‘Nike’ which was worth $660m over three decades. Has he signed a deal with another company? We will find out what Woods will sport in the Genesis Invitational at Riviera Country Club in February and throughout the rest of 2024.

As with any elite athlete there comes a time when the value of endorsements / sponsorship etc and accumulated past income allows them to achieve greater utility levels without working. This concept refers to the income and substitution effect and the backward bending supply curve of labour. Economic theory assumes that there is a positive relationship between labour supply and the wage rate. So, as the wage rate increases, more people are willing to work. This is represented by the individual’s labour supply curve, which mainly slopes upwards. Beyond a certain point, individuals will take the view that they prefer leisure to work. This point is indicated by the backward-sloping curve from point S’. Before this point, an individual worker is more willing to supply his or her labour as the wage rate increases. It must be stressed that this point depends on the individual’s attitude to work and leisure – point S’ on any individual’s supply curve will vary (see graph above).

Therefore professional athletes who reach a certain level of performance, whether it be in golf, tennis, cycling etc tend not to take part in so many events because of their increase in wealth. Appearance money, endorsements as well as prize money mean the income effect increases as the athlete can, in theory, achieve greater utility levels without performing. This may be more prevalent as the athlete enters the latter stages of his/her career. So with Tiger Woods appearing next at Genesis Invitational at Riviera Country Club in February what company will he be endorsing and how many tournaments will he play in 2024?

Source: The Economics of Sport – Leeds, von Allmen and Matheson (2018)

Sign up to elearneconomics for comprehensive key notes with coloured illustrations, flash cards, written answers and multiple-choice tests on the Supply of Labour that provides for users with different learning styles working at their own pace (anywhere at any time).

What are the underlying causes of inflation?

Central bankers have been grappling with the increasing level of inflation in their economy but rates are starting to stabilise – CPI in New Zealand down from 6.9% to 6.7% and from 9.1% to 4% in the US. The US Fed Chair Jerome Powell has recently stated that it is not wage increases that were the reason for higher prices. There have been 3 upsurges in inflation of since the COVID-19 outbreak.

  1. There was transitory inflation as the fiscal stimulus led to people wanting to spend more as supply chains were struggled to keep a pace with this demand for durable goods.
  2. The war in Ukraine saw a spike in energy prices as economic growth recovered from the pandemic. This was independent of transitory inflation.
  3. Profit-led inflation – this is when companies tell consumers a convincing story that allows them to increase their price with out reducing demand for the product and therefore making it more inelastic. Consumers believe the price increase is ‘fair’ or ‘justified’ and expectations are high. This has also been referred to as ‘sellers’ inflation, greedflation, excusflation. Isabella Weber, an economist at the University of Massachusetts at Amherst argues that a lot of the above factors have provided camouflage for firms to raise their prices – see link below from The New Yorker.

Euro inflation

In the Euro area the higher inflation so far mainly reflects higher profits and import prices since 2022. Profits accounted for 45%, import costs 40%, Labour costs 15% and Taxes having a small deflationary impact. However, workers will now be pushing companies for higher wages to maintain their purchasing power which could reduce profit margins to their lowest level since mid-1990’s if inflation is to return to its 2% target.

If profit is the prevalent issue concerning high inflation then other tools should be used like tax policies that target excess profits or incentivise investment in firms to increase aggregate supply (supply-side policies). The policy of interest rates should not be the only tool in the toolbox as there needs to be a better understanding of the causes of high prices the way government’s respond to future shocks.

Sources:

Europe’s Inflation Outlook Depends on How Corporate Profits Absorb Wage Gains. IMF Blog

The New Yorker. What if We’re Thinking About Inflation All Wrong? 6th June 2023

Sign up to elearneconomics for comprehensive key notes with coloured illustrations, flash cards, written answers and multiple-choice tests on Inflation that provides for users with different learning styles working at their own pace (anywhere at any time).

New Zealand’s tight labour market but do all benefit?

Figures out yesterday show that unemployment in New Zealand remained at 3.4% which makes for a very tight labour market. One wonders if this figure is beyond the maximum sustainable levels with the RBNZ worried about the pressure on private sector wages feeding into inflation. The RBNZ would like labour market pressures to ease – i.e. they want unemployment – as this should bring down inflation. However on 18th May the government deliver the Budget and no doubt there will be some fiscal stimulus that the RBNZ will need to be aware of – Expansionary Fiscal Policy vs Contractionary Monetary Policy. It seems the Government want to put money into the circular flow especially as it is election year but the RBNZ want to keep inflation between 1-3%. Ultimately it is Politics vs Economics.

Full employment doesn’t mean all workers benefit
Full employment has normally been the concept that has been used to describe a situation where there is no cyclical or deficient-demand unemployment, but unemployment does exist as allowances must be made for frictional unemployment and seasonal factors – also referred to as the natural rate of unemployment or Non-Accelerating Inflation Rate of Unemployment (NAIRU). Full employment does suggest that the employee has a lot of bargaining power as the supply of labour is scarce relative to the demand. In theory a tight labour market should lead to higher wages and improved conditions of work as the employer has less labour to chose from. We have seen in the labour market incentives for employees in recommending potential candidates for vacancies in the company. Other incentives for potential employees include shorter working weeks, hiring bonuses and special leave days.

Michael Cameron’s article in The Conversation suggest that this doesn’t apply to all workers. A lot depends on the bargaining power of the worker and the elasticity of supply of labour. If the supply is very inelastic for a particular job (higher skilled) it is harder and most likely more expensive for the employer to find an alternative worker. This is evident when unemployment is low as the worker can easily look around at other job opportunities. On the contrary if the supply of labour is more elastic (lower skilled jobs) the worker has less bargaining power and the employer will have more potential workers to chose from. The graph below shows the elasticity of supply of labour – high skilled has a steeper curve (inelastic) whilst low skilled as a flatter curve (elastic)

Source: Economicshelp

ANZ New Zealand Labour Market Review | March 2023 Quarter
Michael Cameron writes in The Conversation

The migration model and the theory of wages

The new prime minister Chris Hipkins stated that he wanted to make it easier for workers to come to New Zealand especially helping those sectors experiencing significant labour shortages but didn’t want to loosen immigration settings too much.

In economic theory the impact of migration we can assume that the supply of labour will shift to the right. This increase in labour supply makes labour less scarce and therefore leads to a reduction in wages. The lower wage means the level of domestic (local workers) employed is reduced. The blue area represents what local workers receive in pay whilst the green area is the immigrant wages. This will cause a transfer of surplus from domestic employees to employers – wage loss to labour but a gain to the employer. There is also a net increase in surplus from that before immigration called ‘Immigration surplus’ – see graph. However does this really happen? The impacts of immigration on the labour market critically depend on:

  • skills of immigrants, the skills of existing workers, and the characteristics of the economy
  • which areas of work are they involved in – skilled / non-skilled
  • immigration leads to more aggregate demand and competition for existing jobs in certain occupations but also create new jobs
  • the immediate impact on wages depends on the skills that substitute or complement existing domestic workers.
  • the extent to which an influx of workers to an economy increases unemployment is dependent on how domestic worker are willing to accept the new lower wages.
  • if skills of immigrants are complementary to those of domestic workers, all workers experience increased productivity which can be expected to lead to a rise in the wages of existing workers.
  • Immigration can also expand demand for labour as consumer demand for goods and services increases, and employers may increase production in sectors where migrant labour is used (e.g. agriculture or care sectors).
  • immigration may change the mix of goods and services produced in the economy and thus the occupational and industrial structure of the labour market. An example here would be the use of technology in the production process.
  • at which part of the business cycle the demand for labour occurs – downturn means slower demand.

With the immigration issue in NZ Shamubeel Eaqub, from Sense Partners, told Radio NZ Checkpoint programme:

“We kind of use it as a political tool to deal with whatever we want to at the time,”

“Currently it happens to be that it’s labour shortages, 10 years ago it was because we wanted population growth and economic growth, and I think it’s really unfair to … use immigrants as these little political chess pieces. We need to be a little bit more structured around what we want it for, that would create more certainty – both for the immigrants and for the businesses in New Zealand.”

A2 Economics – Economic Rent and Transfer Earnings

Economic Rent and Transfer Earnings To most of us “rent” is defined as a periodical payment made for the use of a particular asset – usually a residential or commercial property. However, the concept is not limited to land or buildings because it can also be applied to the other factors of production. When a factor is earning more than its supply price, it is receiving a part of its income in the form of economic rent. This situation arises when demand increases and supply cannot fully respond to the increases in demand. For example, labour already employed will experience an increase in income so that they must be earning more than their supply prices.

Present Wages – Wages when initially employed = Economic Rent

The minimum payment required to prevent a person transferring to another employer or another occupation is know as transfer earnings. It is determined by what the factor could earn in its next best paid employment. Transfer earnings may be regarded as the opportunity cost of keeping an employee in their present job or it may be regarded as the employee’s supply price in their present occupation. For example, if the minimum weekly wage that would persuade someone to work as a shop attendant is $200 but he or she actually receives a wage of $250, then the transfer earnings amount is $200 and he or she is receiving $50 in the form of economic rent. Therefore, economic rent can be defined as any payment to a factor of production that is in excess of transfer earnings.

The graph below shows the demand and supply for labour. The equilibrium wage is $120 with a quantity of 50 units. Total earnings is equal to $120 x 50 units of labour = $6,000 and employees receive the same wage of $120. However, all workers except the last one taken into employment were prepared to offer their services at wages less than $120. Therefore, provided the supply of labour slopes upwards (i.e. it is less than perfectly inelastic) an increase in demand will give rise to rent payments to those factors that were already employed at the original wage of $120. The area of economic rent and transfer earnings is shown in the graph below. Only the last labour unit employed earns no economic rent because the wage of $120 is the supply price to that particular labour unit.

Inelastic and Elastic labour supply

The amount of economic rent and transfer earnings in the return to labour depends upon the elasticity of supply and the level of demand. The greater the occupational mobility of labour, the smaller the element of economic rent. If labour can do a variety of occupations then quite small changes in the wage rate will cause large movements of labour into an industry when wages rise, and out of that industry when wages fall.

Very specialised labour has an inelastic supply curve. This includes surgeons, top CEOs, scientists and jobs that require high skill levels or involve significant danger and skill, eg, deep sea divers. The relatively high rewards to this labour are due to the fact that they are in very scarce supply relative to the demands for their services. Their transfer earnings will be much less than their salary because the market values outside their own specialised professions are probably very low. A frequently quoted example of earnings that contain a large amount of economic rent are those of top sports people. Today these people can earn significant amounts of money in a short period of time. A footballer such as Christiano Ronaldo earns €326 923 per week because of his ability to attract big crowds, merchandise sales and sponsorship deals when he was at Real Madrid Football Club. His skill levels are unique and in very limited supply when considering other players. This reflects a very high marginal productivity leading to a higher wage.

Some other occupations that are held in high regard by society do not command such high salaries because of their low marginal productivity. This includes nurses, firefighters, teachers, etc. Furthermore, the supply of labour for these jobs tends to be elastic because there are many people to choose from, unlike their footballing counterparts who have unique skills.

Quasi rent

Where the supply of labour is less than perfectly elastic an increase in demand will lead to some workers receiving economic rent. This rent may be of a temporary nature, however, because the higher wage may lead to an increase in supply, which in turn, lowers the wage. Increased wages might entice other workers to undertake the necessary training. The economic rent that is earned during the period before supply can be increased is referred to as quasi rent. True economic rent refers to the remuneration of factors that are fixed in supply.

Read more at: elearn Economics – https://www.elearneconomics.com/

Use elearneconomics for immediate personalised feedback on economic rent and transfer earnings  with tasks designed for true student-centred learning and understanding that improves students results and grades. 

Are we actually in recession and is a wage-price spiral on the cards?

For the majority of textbooks a recession is defined as two consecutive quarters of negative GDP. Whilst a lot of economies might technically go through this objective measure in the next year it is a rather strange economic environment that we live. I don’t recall a recession that coincides with record level unemployment, high consumer spending and a huge number of job openings which in turn has led to wage increases. Recession is usually associated with the opposite – high unemployment, low to nil wage growth and little spending. Therefore the economy isn’t in the usual boom-bust cycle but more of an intentional slowdown. Central banks need to get inflation under control by reducing aggregate demand through higher interest rates. Consumer prices, especially in food and energy, rising faster than wages but with wages rising there is a risk of a wage-price spiral. In order to get the inflation down most central banks only have the tools of interest rates and bank liquidity with both currently in the tightening phase.

New Zealand Employment Data – 3rd August 2022

Today’s figures labour data statistics in New Zealand were interesting to say the least. Although unemployment went up 0.1% to 3.3% against expectations it was wage growth of 7% that really stood out and reflected a really tight labour market almost matching the CPI of 7.3%. This is a major concern for the RBNZ the labour market appears to be the major driver of inflation and the threat of a wage-price spiral is very real. A self-perpetuating inflation cycle could cause domestic inflation in New Zealand to remain high, even if global pressure start to ease. In previous periods of inflation the RBNZ got help in the form of redundancies that forced numbers of consumers to cut their spending. This is unlikely in such labour market conditions and what can be sure is that the OCR will be on the rise again and is likely to increase to 4% by the end of the year.

Theory behind the wage-price spiral

As from previous posts, the Phillips Curve analysed data for money wages against the rate of unemployment over the period 1862-1958. Money wages and prices were seen to be strongly correlated, mainly because the former are the most significant costs of production. Hence the resulting curve purported to provide a “trade-off’ between inflation and unemployment – i.e. the government could ‘select’ its desired position on the curve. During the 1970’s higher rates of inflation than previously were associated with any given level of unemployment. It was generally considered that the whole curve had shifted right – i.e. to achieve full employment a higher rate of inflation than previously had to be accepted.

Milton Friedman’s expectations-augmented Phillips Curve denies the existence of any long-run trade off between inflation and unemployment. In short, attempts to reduce unemployment below its natural rate by fiscal reflation will succeed only at the cost of generating a wage-price spiral, as wages are quickly cancelled out by increases in prices.

Each time the government reflates the economy, a period of accelerating inflation will follow a temporary fall in unemployment as workers anticipate a future rise in inflation in their pay demands, and unemployment returns to its natural rate.

The process can be seen in the diagram below – a movement from A to B to C to D to E

Friedman thus concludes that the long-run Phillips Curve (LRPC) is vertical (at the natural rate of unemployment), and the following propositions emerge:

1. At the natural rate of unemployment, the rate of inflation will be constant (but not necessarily zero).

2. The rate of unemployment can only be maintained below its natural rate at the cost of accelerating inflation. (Reflation is doomed to failure).

3. Reduction in the rate of inflation requires deflation in the economy – i.e. unemployment must rise (in the short term at least) above its natural rate.

Some economists go still further, and argue that the natural rate has increased over time and that the LRPC slopes upwards to the right. If inflation is persistently higher in one country that elsewhere, the resulting loss of competitiveness reduces sales and destroys capacity. Hence inflation is seen to be a cause of higher inflation.

Rational expectations theorists deny Friedman’s view that reflation reduces unemployment even in the short-run. Since economic agents on average correctly predicted that the outcome of reflation will be higher inflation, higher money wages have no effect upon employment and the result of relations simply a movement up the LRPC to a higher level of inflation.

Full employment doesn’t mean all workers benefit

Michael Cameron in his blog ‘Sex, Drugs and Economics’ wrote a piece on full employment and the fact that it doesn’t benefit all workers. It was based on his published article in The Conversation.

Full employment has normally been the concept that has been used to describe a situation where there is no cyclical or deficient-demand unemployment, but unemployment does exist as allowances must be made for frictional unemployment and seasonal factors – also referred to as the natural rate of unemployment or Non-Accelerating Inflation Rate of Unemployment (NAIRU). Full employment does suggest that the employee has a lot of bargaining power as the supply of labour is scarce relative to the demand. In theory a tight labour market should lead to higher wages and improved conditions of work as the employer has less labour to chose from. We have seen in the labour market incentives for employees in recommending potential candidates for vacancies in the company. Other incentives for potential employees include shorter working weeks, hiring bonuses and special leave days.

However this doesn’t apply to all workers as Michael Cameron alludes to. A lot depends on the bargaining power of the worker and the elasticity of supply of labour. If the supply is very inelastic for a particular job (higher skilled) it is harder and most likely more expensive for the employer to find an alternative worker. This is evident when unemployment is low as the worker can easily look around at other job opportunities. On the contrary if the supply of labour is more elastic (lower skilled jobs) the worker has less bargaining power and the employer will have more potential workers to chose from. The graph below shows the elasticity of supply of labour – high skilled has a steeper curve (inelastic) whilst low skilled as a flatter curve (elastic)

Source: Economicshelp

Cameron writes in The Conversation:

Many low-income workers are in jobs that are part-time, fixed-term or precarious. Low-wage workers are not benefiting from the tight labour market to the same extent as more highly qualified workers.

Nevertheless, a period of full employment may allow some low-wage workers to move into higher paying jobs, or jobs that are less precarious and/or offer better work conditions. That relies on the workers having the appropriate skills and experience for higher-paying jobs, or for increasingly desperate employers to adjust their employment standards to meet those of the available job applicants.

Add to this the increase in the cost of living and those in low skilled jobs with little bargaining power are under pressure to accept whatever is available. The alternative is welfare benefits which are always playing catch-up

New Zealand inflation hits 5.9%. Potential for wage price spiral?

Consumer prices in New Zealand rose 5.9% annually in the December quarter.
Core inflation measures rose to 5.4% annually. Core inflation excludes certain items that are known for their volatility — namely, food and energy. With this figures it seems that ‘transitory’ inflation is not as relevant and inflation does have some momentum. There is a lot inflation coming in from abroad with Tradable inflation at 6.9%.

Domestic inflation was also strong with non-tradable inflation at 5.3%. Some of the main movers in the CPI:

  • Construction costs up by 15.7%annually – major supply chain issues here
  • Petrol prices up by 30.5% annually – reflects rises in oil prices globally and a weak NZ dollar making imports more expensive.
  • Food – annual change in food prices was 4.1% although the quarterly change was -0.1%
  • 40% of CPI is made up of imports and with inflationary pressure prevalent in the global economy this has led to higher import prices.

Higher inflation in a tight labour market – wage price spiral.
With a tight labour market comes pressure on wages and if they increase and are not accompanied by an increase in output/worker, companies have two choices. Either they absorb the higher costs or they put their prices up. Then with higher prices there is pressure on wages again as employees try to maintain their purchasing power which in turn could lead to a wage-price spiral.

Theory behind the wage-price spiral

As from previous posts, the Phillips Curve analysed data for money wages against the rate of unemployment over the period 1862-1958. Money wages and prices were seen to be strongly correlated, mainly because the former are the most significant costs of production. Hence the resulting curve purported to provide a “trade-off’ between inflation and unemployment – i.e. the government could ‘select’ its desired position on the curve. During the 1970’s higher rates of inflation than previously were associated with any given level of unemployment. It was generally considered that the whole curve had shifted right – i.e. to achieve full employment a higher rate of inflation than previously had to be accepted.

Milton Friedman’s expectations-augmented Phillips Curve denies the existence of any long-run trade off between inflation and unemployment. In short, attempts to reduce unemployment below its natural rate by fiscal reflation will succeed only at the cost of generating a wage-price spiral, as wages are quickly cancelled out by increases in prices.

Each time the government reflates the economy, a period of accelerating inflation will follow a temporary fall in unemployment as workers anticipate a future rise in inflation in their pay demands, and unemployment returns to its natural rate.

The process can be seen in the diagram below – a movement from A to B to C to D to E

Friedman thus concludes that the long-run Phillips Curve (LRPC) is vertical (at the natural rate of unemployment), and the following propositions emerge:

1. At the natural rate of unemployment, the rate of inflation will be constant (but not necessarily zero).

2. The rate of unemployment can only be maintained below its natural rate at the cost of accelerating inflation. (Reflation is doomed to failure).

3. Reduction in the rate of inflation requires deflation in the economy – i.e. unemployment must rise (in the short term at least) above its natural rate.

Some economists go still further, and argue that the natural rate has increased over time and that the LRPC slopes upwards to the right. If inflation is persistently higher in one country that elsewhere, the resulting loss of competitiveness reduces sales and destroys capacity. Hence inflation is seen to be a cause of higher inflation.

Rational expectations theorists deny Friedman’s view that reflation reduces unemployment even in the short-run. Since economic agents on average correctly predicted that the outcome of reflation will be higher inflation, higher money wages have no effect upon employment and the result of relations simply a movement up the LRPC to a higher level of inflation.

Source: ANZ Research December 2021 Quarter CPI Review

US Economy – potential for wage-price spiral

In the past expansionary monetary policy (low interest rates) would have acted as a catalyst to the real danger of a wage price spiral in which rising wages and prices become self-reinforcing, pushing inflation up. This was very apparent in the winter of 1974 in the US when inflation reached 12% and 15% by 1980. Is there the threat of another wage price spiral? Current employment conditions are very much in the favour of the employee. According to The Economist some combination of the following needs to happen to avoid inflation:

  • Rather than raising their prices firms absorb higher wages and have lower profits thereby not raising inflation.
  • The increase in real wages is matched by productivity growth – more demand is matched by more supply.
  • Workers return to the labour market therefore increasing supply and reducing the pressure on wages

Below is a very detailed look at the threat of a wage-price spiral in rhe US. Good discussion of labour market data and the impact of COVID on inflation. Is this inflation period is transitory or a more permanent fixture? Well worth a look

Theory behind the wage-price spiral

As from previous posts, the Phillips Curve analysed data for money wages against the rate of unemployment over the period 1862-1958. Money wages and prices were seen to be strongly correlated, mainly because the former are the most significant costs of production. Hence the resulting curve purported to provide a “trade-off’ between inflation and unemployment – i.e. the government could ‘select’ its desired position on the curve. During the 1970’s higher rates of inflation than previously were associated with any given level of unemployment. It was generally considered that the whole curve had shifted right – i.e. to achieve full employment a higher rate of inflation than previously had to be accepted.

Milton Friedman’s expectations-augmented Phillips Curve denies the existence of any long-run trade off between inflation and unemployment. In short, attempts to reduce unemployment below its natural rate by fiscal reflation will succeed only at the cost of generating a wage-price spiral, as wages are quickly cancelled out by increases in prices.

Each time the government reflates the economy, a period of accelerating inflation will follow a temporary fall in unemployment as workers anticipate a future rise in inflation in their pay demands, and unemployment returns to its natural rate.

The process can be seen in the diagram below – a movement from A to B to C to D to E

Friedman thus concludes that the long-run Phillips Curve (LRPC) is vertical (at the natural rate of unemployment), and the following propositions emerge:

1. At the natural rate of unemployment, the rate of inflation will be constant (but not necessarily zero).

2. The rate of unemployment can only be maintained below its natural rate at the cost of accelerating inflation. (Reflation is doomed to failure).

3. Reduction in the rate of inflation requires deflation in the economy – i.e. unemployment must rise (in the short term at least) above its natural rate.

Some economists go still further, and argue that the natural rate has increased over time and that the LRPC slopes upwards to the right. If inflation is persistently higher in one country that elsewhere, the resulting loss of competitiveness reduces sales and destroys capacity. Hence inflation is seen to be a cause of higher inflation.

Rational expectations theorists deny Friedman’s view that reflation reduces unemployment even in the short-run. Since economic agents on average correctly predicted that the outcome of reflation will be higher inflation, higher money wages have no effect upon employment and the result of relations simply a movement up the LRPC to a higher level of inflation.

UK growers see high wage inflation.

Since 2016 UK growers of fruit and vegetables have seen their labour costs rise by at least 34% since 2016. This is when farmgate prices have stayed virtually the same.
This increase threatens domestic production in the UK growers and they need a higher price to halt them locating overseas or finding another revenue stream with the land that they have.

Between 2015 and 2020 there has been an increase in the hourly rate for workers of 34% rising from £6.50/hour (NZ$12.40) to £8.72/hour (NZ$16.63). However many growers have seen a 40-50% rise in employment costs since 2015 as:

  1. Lower output and reduction in productivity with newly recruited UK labour because of Brexit. Fruit and vegetables are normally picked by some 70,000 to 80,000 migrant workers, mainly from eastern Europe who tend to be much more productive than local labour. From this year any foreign worker wanting to come to the UK will have to meet a minimum salary threshold of 25,600 – well above what farm pickers would normally be paid.
  2. A weaker £ also makes it less attractive for foreign workers as when they convert their income in £ it buys them less of their own currency.
UK Farmers Weekly

Labour costs account for 40-70% of a growers revenue which mean some are seriously looking at the financial viability of their business. This is concerning as the domestic growing industry contributes more than £3.8bn to the UK economy. What is true is that although some agricultural sectors are highly mechanised there is still a need for manual jobs carried out by labour. A report, by farm consultant Andersons suggested that a farmgate price increase of between 9% and 19% is needed simply to offset the increase in the National Living Wage (NLW) hourly rate – it will rise to £8.91/hour (NZ$17.12) from 1 April 2021. The problem with the NLW is that it doesn’t take into consideration the differences in the cost of living in a country e.g. London as compared to Manchester. However evidence suggests that workers are more motivated when the living wage is being paid and staff retention is higher.

Source: UK Farmers Weekly 15th February 2021

New Zealand’s unemployment and wages

In the September quarter New Zealand’s unemployment rate was 4.2% which was up 0.3% from the June quarter. Since the global financial crisis unemployment figures have been trending downwards since it peak of 6.7% in the September 2012. Despite the quarterly rise in unemployment, the underutilisation rate, which is a broader measure of spare capacity in the labour market, has fallen to the lowest level in over eleven years. The fall in underutilisation this quarter was driven by a drop in the number of underemployed people, those who work part time but are looking to work more hours.

Source: Economic Overview – Westpac November 2019

During 2019 the labour market appears to have tightened but it does appear to lag behind the growth cycle meaning that with the slowdown in growth in 2019 higher levels of unemployment will be apparent early this year. It is interesting to note that as labour becomes more scarce with lower levels of unemployment wage growth usually follows – see graph.

Annual wage growth is at its highest level since the 2008 global financial crisis, after which wage growth remained largely flat. The percentage of wages that increased is at its highest level since March 2015, at 59%. This shows there has been more broad-based wage growth across the Labour Cost Index* (LCI). Salary and wage rates for the public sector increased 3.0 percent annually, the highest rate since June 2009. This compares to a 2.2 percent increase in the year to the June 2019 quarter. Public sector wage rates have been driven by collective agreements for teachers, nurses, and police over the past year. With these three largest occupations excluded, public sector wages would have increased 1.8 percent annually.

*The labour cost index (LCI) measures changes in labour costs. These costs consist of base salary and ordinary-time wage rates, overtime wage rates, and non-wage labour-related costs. The index essentially covers all employees aged 15 years and over, in all occupations, and in all industries except domestic services.

Sources:
Department of Statistics NZ
Westpac Quarterly Overview – November 2019

Tight labour market in Japan but wages stagnant.

As is mentioned in simple economic theory, when you have a good or service that becomes more scarce there is an increase in the value of that good or service. The labour market in Japan is becoming very tight in that the supply of labour is starting to decrease with the demand increasing – see graph. This should ultimately lead to higher wage demands by workers as they are becoming more and more scarce relative to the demand. Recent figures out of Japan show this situation:

Japan labour market* Working age population – 15-64 years in Japan – fallen by 3.8m since December 2012 = decrease in supply of labour = upward pressure on wages
* People actually working has increased by 2.2m = increase in demand for labour = upward pressure on wages
* Unemployment in Japan = 2.8% the lowest rate since 1994 = upward pressure on wages

Why has there been no increase in Japanese wages?

Japanese labour unions have not been very aggressive in wage bargaining and there was a wage increase of only 0.2% in 2016 but already in negative territory this year – see chart. Wages have remained stagnant as strong demand has resulted in an increase in supply of labour rather than the price of labour – wages.

Japan - wage growth
Supply of labour increase:
* Japan now has 1 million foreign workers as compared to 680,000 in 2012
* Numbers of elderly men and women in the workforce has increased by over 2 million
* There is a rising share of part-time work

Job security at the expenses of wage increases.
It seems that market forces don’t really affect those employed in large firms. The pay in these firms has been largely unresponsive to the pressure of supply and demand as employees of life-time employment do not worry about being made redundant but don’t expect significant pay rises during the good times. However in times of inflation they do request higher pay to offset the increased cost of living.

So if general workers pay does increase there is the possibility of the general level of prices will also go up which would in turn increases the wage demands of those in large firms. However as stated by The Economist

“Japan’s workers are hugely in demand but strangely undemanding.”

Hays Global Skills Index

A colleague alerted me to the Hays Global Skills Index. It is a complex, statistically-based report designed to assess the dynamics of skilled labour markets across 33 countries.

Seven indicators make up the Hays Global Skills Index

  1. Education flexibility – this indicator relates to how flexible the education system is to meet the changing demands of the labour market. Low score = more likely.
  2. Labour market participation – greater participation means more potential workers. Low score = larger pool of workers
  3. Labour market flexibility – this relates to government regulations around employing people. Low score = less red tape
  4. Talent mismatch – do the skills of the labour force match those of the jobs that are in the market place? Low score = employers find it easier to get labour with appropriate skills
  5. Overall wage pressure – skills shortages are an issue if wages are growing faster than the cost of living. Low score = wages are not rising quickly.
  6. Wage pressure in high-skill industries – Some industries require higher‑skilled staff and makes them more vulnerable to skills shortages. Low score = wages in high-skill industries are growing slower than wages in low-skill industries.
  7. Wage pressure in high-skill occupations – a rise is wages of high-skilled occupations means that there is a shortage. Low score = wages for high-skilled occupations are rising more slowly than those in low-skill occupations.

In looking at the figure below seven indicators above are given equal weight when calculating the overall Index score for each country. Each indicator measures how much pressure different factors are exerting on the local labour market.

Higher scores mean that a country is experiencing more pressure than has historically been the case.

Lower scores mean that a country is experiencing less pressure than has historically been the case.

hays-global-skills

Skilled labour market conditions vary markedly in different parts of the world. Grouped into large overarching regions, however, it is possible to discern some headline patterns. The overall Index score increased slightly from 2015, as changes in skilled labour market conditions in Europe and the Middle East (EME) more than offset a very slight loosening in the Americas and Asia Pacific. The annual change in Index scores should not mask the overall position that suggests skilled labour markets in the Americas and EME remain tight relative to the past, while Asia Pacific remains little changed from historic trends. Source: Hays Index 

Technology, jobs and the universal basic income

Tech and Jobs
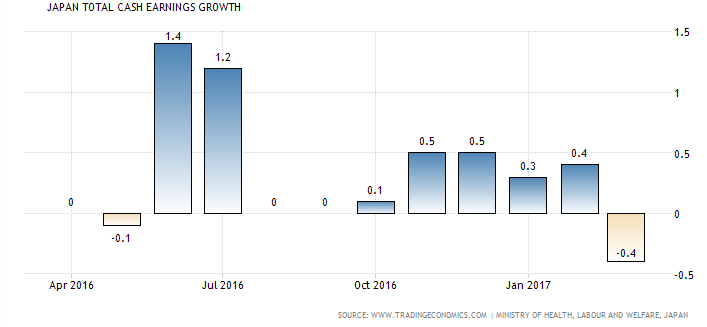
It is nothing new to consider how machines can perform the tasks done by the layout force. Experts believe that it is not blue collar or white collar jobs that are at risk but those jobs that are routine or non routine. Manual labour tasks have been constantly under pressure from technology but now more jobs that have cognitive tasks are now feeling the pinch.

Jobs said to be under threat from computerisation are:

  • taxi and delivery drivers
  • receptionists and security guards
  • cashiers, counter and rental clerks, telemarketers and accountants

It is estimated that the development of machine learning will impact 35% of the workforce in Britain and 49% for Japan. See chart from The Economist – Computerisation of different occupations.

Job Polarisation – Middle Skills Jobs v Low-Skill and High-Skill Jobs

Economists are already worrying about “job polarisation”, where middle-skill jobs (such as those in manufacturing) are declining but both low-skill and high-skill jobs are expanding. In effect, the workforce bifurcates into two groups doing non-routine work: highly paid, skilled workers (such as architects and senior managers) on the one hand and low-paid, unskilled workers (such as cleaners and burger-flippers) on the other.  

Source: The Economist June 25th 2016

Universal Basic Income

After two centuries in which capitalism has dominated the western world, this economic system has become desperately dysfunctional: inequality is growing, climate change is accelerating and nations are beset with bad demographics, debt burdens and angry voters.

Paul Mason – Channel 4 economics correspondent and author of ‘PostCapitalism: A Guide to Our Future’ states that:

“information technology has reduced the need for work” — or, more accurately, for all humans to be workers. For automation is now replacing jobs at a startling speed

“information goods are corroding the market’s ability to form prices correctly”. For the key point about cyber-information is that it can be replicated endlessly, for free; there is no constraint on how many times we can copy and paste a Wikipedia page. “Until we had shareable information goods, the basic law of economics was that everything is scarce. Supply and demand assumes scarcity. Now certain goods are not scarce, they are abundant.”

“goods, services and organisations are appearing that no longer respond to the dictates of the market and the managerial hierarchy”. More specifically, people are collaborating in a manner that does not always make sense to traditional economists, who are used to assuming that humans act in self-interest and price things according to supply and demand.

There is concerns in many countries as to what can be done with a growing labour force with limited job prospects. There have been call for more money given towards social welfare to protect those impacted by the changes to the labour market and assist them move to new jobs. Some have favored a universal basic income instead of the welfare system that involves paying a fixed amount each year to all citizens to actually exist – rather than tax to exist. Supporters of this idea argue that:

  • People who are not working, or are working part-time, are not penalised if they decide to work more, because their welfare payments do not decline as their incomes rise.
  • It gives people more freedom to decide how many hours they wish to work, and might also encourage them to retrain by providing them with a small guaranteed income while they do so.
  • Those who predict significant job destruction see it as a way to keep the consumer economy going and support the non-working population.
  • If most jobs are automated away, an alternative mechanism for redistributing wealth will be needed.

However those against this idea argue that:

  • It is regressive as spending on existing welfare schemes would reduce income for the poorest, while giving the high incomes money they do not need.
  • Furthermore funding such a venture would require a much higher tax rate that at present.
  • The basic income would discourage some people from retraining, or indeed working at all—why not play video games all day?—though studies of previous experiments with a basic income suggest that it encourages people to reduce their working hours slightly, rather than giving up work altogether.

Whether technology will take over jobs and ultimately humanity is dependent on the rate of change and how we live through the long transition from capitalism (the state and the market) – to post capitalism (the state, the market and the shared collaborative economy).

Human nature is not a machine to be built after a model, and set to do exactly the work prescribed for it, but a tree, which requires to grow and develop itself on all sides, according to the tendency of the inward forces which make it a living thing.  John Stuart Mill

Source: The Economist June 25th 2016

Wages and performance in the English Premier League

With Leicester City being crowned as EPL champions it was only time before someone in the media produced data showing the correlation between a club’s wage bill and their final position in the EPL. What is so extraordinary about Leicester’s feat what that it wasn’t a one off victory in the FA Cup or something similar but a competition that involved 38 games in the season. With Leicester just surviving relegation last year the odds on them winning the EPL were 5,000 to 1. What is so unique about their feat is that since the 1995-96 season the champion side has spent 225% more on player salaries as the median team. Arsenal, Chelsea, Manchester Utd and Liverpool have paid the highest wages to its squad of players and finished in the top four positions in the EPL 80% of the time. The total cost of Leicester’s regular team (£25m, or $36m) this season was less than a quarter of what Manchester United spent on new players last summer. Furthermore, if you look at Leicester City’s wage bill this year it is 75% of the league median which makes them, after Newcastle Utd in 2001-02, to break into the top four with a below-median wage bill.

Temporary Situation

However, Leicester’s success means that affluent clubs will spend even more money on sports science, video analysis and get the best people to work in these departments. No doubt that this will move the transfer market towards ‘perfect competition’ as information will flow more easily and clubs will not be able to benefit like Leicester in picking up players whose value has been underpriced. Therefore an advantage by one club will lead to only a temporary advantage until other clubs catch up. Consequently things will return to normal as talent will be distributed to those who can pay the most.

Click here to go to The Economist website to access their interactive image.

EPL Wages and Position

Union Membership and Inequality

From the blog azizonomics – Union Members and Inequality. Below is a very significant graphic

Union Membership Top 10%
Union membership and minimum wages are usually thought to reduce inequality by helping the distribution of wages. However although stronger unions and an increase in the minimum wage has the potential to reduce inequality, the fact that wages go above the market-clearing level could mean unemployment increases leading to higher inequality.

Strong unions can persuade political parties to engage in more redistributive policies. By getting workers to vote for parties that promise these policies there is a greater chance of them being implemented.

Are higher wages the answer to the US economy?

Fair PayThere have been some concerns over the extent of the recovery of the US economy over the last year. The GDP of a country is made up of four things:
C+I+G+(X-M).

C = Private Consumption
I = Business Investment
G = Government Demand
(X-M) = Net Exports

With government spending being very liberal and effective in creating growth there is a need for the other components of GDP to do their part – Private Consumption, Business Investment and Net Exports.

Exports in the US have been disappointing equaling 14% of GDP compared to the euro zone’s 26%.

Business investment has also been subdued as lower profits mean less investment.

Private consumption hasn’t been as strong as anticipated even with the windfall gain of the significant fall in oil price and the growth of outstanding consumer credit. The biggest barrier to increasing private consumption is the level of pay to employees. Across the US median inflation-adjusted wages are not higher today than they were pre GFC.

Why are wages so low?
The Economist identified three things that have been behind the slow growth of wages in the US.

1. America’s Unemployment-Insurance

With the US government cutting back on unemployment benefits the wage expectations of workers fell. Businesses took advantage of this cheaper pool of labour and in 2014 a significant proportion of the 31 million jobs created wherein poorly paid industries.

2. The Behaviour of Firms
When the GFC hit firms found it difficult to reduce the wages of their staff but fired their least productive workers keeping the most productive happy. To compensate for the higher wages paid to the most productive firms were willing to offer new recruits only low wages.

3. Persistent Labour Market Slack

As there are worker available to fill jobs that become available firms are able to offer paltry wages. The number of part-time workers who would rather be full timers – called part-time for economic reasons (PTER) – fell much more slowly than the official unemployment rate following the GFC. The same can be said for discouraged workers i.e. the number of those wanting a job but say there is no point in looking. Research has found that a 1% fall in the PTER rate is associated with 0.4% fall in real wage growth. When the PTER is high, workers may feel unable to ask for higher wages, since what they really want is more hours.

It seems that the US economy lives and dies by what happens to consumer spending.

Big Firms = Greater Inequality?

inequality2The Economist in their Free Exchange column had an interesting piece on the size of firms and the growing disparity in wages.  In America the best-paid 1% of workers earned 191% more in real (ie, inflation-adjusted) terms in 2011 than they did in 1980, whereas the wages of the middle fifth fell by 5%.

Economists have long recognised that economies of scale allow workers at bigger firms to be more productive than those at smaller ones. That, in turn, allows the bigger firms to pay higher wages. This should not, in theory, cause a rise in inequality. If the chief executive and cleaner at a larger firm are both paid 10% more than their counterparts at a small firm, the ratio between their wages—and thus the overall level of inequality—should remain the same.

However two reasons are given for why this has not happened:
1. Larger firms find it easier to to automate tasks than smaller ones and if there is resistance from unskilled workers over the wage rate then mechanisation is always another option.
2. Because of the potential promotional prospects in a big firm workers are more willing to accept lower wages.

But if governments wish to reverse the inequality big firms foment, reforms to the labour market are unlikely to do the trick. Instead, they will have to spur competition by reducing barriers to entry for smaller firms, most notably by improving their access to credit. That should reduce income inequality and boost economic growth at the same time.

Source: The Economist

Why does rising employment not lead to higher wages?

Unemployment figures in the US, Japan and the UK have reached levels that are below pre-crisis lows. In the US economy recent figures show that since 2010 10 million American workers have found employment – unemployment has fallen by 40%. Similarly in Japan the number of unemployed has fallen from 3.6 million to 2.3 million and in the UK the unemployed figures have been cut by 50% with 800,000 unemployed. The question that needs to be answered here is why has wage growth been stagnant when the demand for labour has increased? See graph below for USA.

Wage growth US


The rationale behind this is that these economies have experienced an increase in uncertain forms of employment:
* part-time work has risen
* there is an increase of the underemployed where more hours could be worked
* looser contracts have helped create flexible workforces
* in general workers bargaining power has dropped

As a result of little wage growth there has been some political backlash:
* Obama has urged congress to increase the minimum wage form $7.25 – $10.10
* Both the main parties in the UK plan to clarify when insecure ‘zero hours’ contracts are abusive
* In Japan Shinzo Abe (PM) recently announced that temporary workers should expect the same deals as their full-time permanent colleagues.

As these steps lift pay and firms’ costs, inflation should follow.

Source: Economist March 2015