Concentration ratio of the Premier League, La Liga, Bundesliga and Serie A

I have blogged on concentration ratios before and currently covering it with my A2 class. This topic can be a multiple-choice question or part of a market structures essay/data response.

The concentration ratio is the percentage of market share taken up by the largest firms. It could be a 3 firm concentration ratio (market share of 3 biggest) or 5 firms concentration ratio. Concentration ratios are used to determine the market structure and competitiveness of the market. The most commonly used are 4, 5 or 8 firm concentration ratios which measure the proportion of the market’s output provided by the largest 4, 5 or 8 firms.

Example of a hypothetical concentration ratio. The following are the annual sales, in $m, of the six firms in a hypothetical market:
Firm A = 56 – Firm B = 43 – Firm C = 22 – Firm D = 12 – Firm E = 3 – Firm F = 1

In this hypothetical case, the 3-firm concentration ratio is 88.3%, that is 121/137 x 100.

HHI and European Football
However, we can apply a similar calculation to measure the concentration of football league championships. The Herfindahl-Hirschman Index (HHI) was originally developed to measure the concentration of firms in an industry, but it has been used in football. To work out the HHI (see equation) you count the number of championships a team won (Ci) within a given time period, dividing by the number of years in the period (N), squaring the fraction, and adding the fractions for all teams.

If the HHI is a maximum 1 this indicates a perfect imbalance and one team has been champion for all years. The minimum HHI value is 0.1 and this means that there has been a different winner each year. Below is the HHI in various European leagues between 2012-13 to 2021-22.

Distribution of championships in European Leagues – 2012-13 to 2021-22 (10 years)

From the above table this to the big football leagues in Europe we see that the distribution of championships is high skewed toward a few dominant teams. In all four leagues one team has won at least 5 championships over the 10 years with Bayern Munich being totally dominant in the Bundesliga winning all 10 – HHI = 1. In a lot of cases the runner-up in these leagues is also featured as a championship winner. La Liga and the EPL had two teams that were 1st or 2nd in most years – Barcelona or Real Madrid, Manchester City or Liverpool. To the extent that teams can ‘buy championships’ because they have more revenue than their competitors, differences in market size and team popularity may be to blame. The EPL is the most balanced of the league with a HHI = 0.32 with La Liga HHI = 0.38. This lack of competitive balance combined with the extraordinary popularity of European football provides additional evidence that fans may be less concerned with the competitive balance that one might think.

Source: The Economics of Sport (2018) – M. Leeds, P. Von Allmen and V. Matheson

Sign up to elearneconomics for comprehensive key notes with coloured illustrations, flash cards, written answers and multiple-choice tests on Concentration Ratio that provides for users with different learning styles working at their own pace (anywhere at any time).
 

Price elasticity of demand and Premier League replica shirts. Do they pay the players wages?

Listening to the Podcast ‘The Price of Football’ the theory of price elasticity of demand was raised with regard to the sale of Premier League replica shirts. Should clubs actually reduce the price of shirts in order to increase demand and raise revenue revenue for the club? The theory measures the relative amount by which the quantity demanded will change in response to change in the price of a particular good. What price elasticity of demand figures tell us:

Over the years shirt prices have increased but clubs have found that there has been little resistance with the consumer is still buying them – very much inelastic demand. So how much do clubs make from selling shirts? There is an assumption that they make a lot of money but in the larger scheme of things it really isn’t that much. Every time you get a big name transfer, whether it be Messi and Neymar to PSG or Haaland to Man City there is a flurry of activity to buy the replica shirt with the players name on it. The reality is that a typical club only gets about a 7.5% commission on each shirt or as is the case of Liverpool 20% which is unique. The table below looks at the number of shirts sold and the revenue from retail in 2022.

Do shirt sales pay for transfer fees?
To put it into context say a Premier League club sells 100,000 shirts in a season at £75 each. That price would generate a total revenue of £7.5 million, of which a club would typically receive a 7.5% fee = £562,500. Liverpool with a 20% commission would make £1.5m. So the myth of shirt sales covering transfer fees doesn’t really stack up. Mo Salah’s earns a weekly income of £1m and for Liverpool to pay his wage from shirt sales they would need to sell to 66,666 per week.

For clubs replica shirts are just a small part of the revenue stream but it is the sponsorship fee from the brand – Adidas, Nike, Puma, Umbro – where the money is. The table above shows the top 7 deals in the Premier League. Notice the big drop off to 6th – Spurs – and especially to 7th – Everton.

Sources:

Sports Journal

Sign up to elearneconomics for comprehensive key notes with coloured illustrations, flash cards, written answers and multiple-choice tests on Elasticity of Demand that provides for users with different learning styles working at their own pace (anywhere at any time).

Liverpool v Man City and variable ticket pricing

I blogged on this before but thought it would appropriate to mention it again on the eve of the big game in Premier League today. When Liverpool play Manchester City at Anfield in the English Premier League on 10th March tickets will be very sought after (increase in demand) with both teams in the running for the EPL title. Because of the importance of such a game Liverpool FC can charge a higher price for tickets in order to maximise profits. This is referred to as variable ticket pricing (VTP) as ticket prices are set according to expected demand for a future game. This is widely used in the EPL and this year ticket prices at Anfield vary considerably for newly promoted Burnley and title holder Manchester City – see below. Prices from Live Football Tickets

From Liverpool’s perspective differences in demand create an opportunity for the club to maximise profits. The assumption is that attendances at Anfield will be similar for earlier games against clubs in the EPL – Nottingham Forest – 50,000 and Arsenal 58,000 (capacity). With the soon to be completed Anfield Road Stand the capacity is set to be 61,000.

For the firm profit is maximised at the rate of output where the positive difference between total revenues and total costs is the greatest. Using marginal analysis, the firm will produce at a rate of output where marginal revenue equals marginal cost. Remember that the firm will make profits as long as the extra revenue brought in from selling the last unit of output(MR) is greater than the extra cost which is incurred in producing it(MC).

In the graph it can be assumed that the marginal cost of hosting a game is essentially zero up to the point of the stadium’s capacity (58,000) as costs are about the same no matter how many fans attend. The demand curve for the Burnley game is AR2 and demand for the Manchester City game is AR1. A team using variable ticket pricing sets marginal revenue equal to marginal cost for each game – MC=MR1 and MC=MR2 resulting in prices of £399 and £189 respectively. Marginal analysis is in the syllabus of most introductory economics courses, in particular Cambridge A2 level, IB and NCEA Level 3.

Sign up to elearneconomics for comprehensive key notes with coloured illustrations, flash cards, written answers and multiple-choice tests on Marginal Analysis that provides for users with different learning styles working at their own pace (anywhere at any time).

Liverpool FC – performance is not so much about money

The Liverpool v Chelsea Carabao Cup Final was seen as an opportunity for Chelsea’s new owners to get their hands on some silverware. Chelsea must have fancied their chances with the Liverpool side fielding five academy players and missing the likes of Mo Salah, Trent Alexander-Arnold, Joel Matip, Alisson, Curtis Jones, Diogo Jota, Thiago Alcantara, Darwin Núñez and Stefan Bajcetic. As a consequence the value of both teams at the final whistle was very unequal. Chelsea being valued at £521m and Liverpool £163.3m – see image.

However as a manager of a football team one of the most important aspects of the job is motivating your players and developing a winning culture. Jurgen Klopp fostered a sense of unity, commitment, and resilience among his players, which is crucial to their success. Faced with these numerous injuries his ability to inspire players in difficult times was evident in the Carabao Cup Final. Also Klopp’s willingness to experiment with new formations and younger players demonstrated his commitment to improvement and depth in the squad.

Klopp’s emphasis on teamwork and camaraderie can serve as an inspiration and it draws on parallels between his role as a football manager and that of a CEO in which there is a transferability of key leadership attributes.

Source: The Telegraph – Jurgen Klopp’s kids secure one of his greatest achievements – and true Liverpool legacy. 25-2-24

For more on Labour Economics view the key notes (accompanied by fully coloured diagrams/models) on elearneconomics that will assist students to understand concepts and terms for external examinations, assignments or topic tests.

Chelsea and the most expensive substitution in football

There has been a lot of talk in football circles about the size of the Chelsea squad. There are currently over 30 players in the the first-team squad and they recently had to increase the size of the changing room to accommodate everyone. This squad size has come to the attention of the Financial Fair Play (FFP) authorities and it will necessitate a sale of some players. With a squad this size there are significant bills to pay not least the transfer fees for a number of top players.

The Price of Football is a podcast that I listen to regularly and it is presented by University of Liverpool football finance lecturer Kieran Maguire and comedian Kevin Day. They discuss some of the financial issues behind the world of football.

A recent episode – click here – looked at the most expensive substitution which was made at Stanford Bridge. The game was between Chelsea and Brighton and Hove Albion and took place in the 57th minute on Sunday 16th April 2023. The total transfer value (what Chelsea paid for these players) was those being substituted = £281.5m and those coming on to the field of play = £84.6m giving a total value of both = £366.1m. This is a sizeable amount of money and you wonder how clubs/owners can afford it.

For more on Economics and Sport view the key notes (accompanied by fully coloured diagrams/models) on elearneconomics that will assist students to understand concepts and terms for external examinations, assignments or topic tests.

Premier League: higher wages = higher league position

Looking at the Deloitte analysis of “Annual Review of Football Finance 2022” the correlation between wage costs and league position is still very strong. Overall wage costs actually increased by 5% to £3.5 billion in 2020/21 eventhough clubs had agreed to wage cuts with the impact of COVID-19. However with revenue outstripping the growth in wages, the division’s wages/revenue ratio has reduced from 73% in 2019/20 to 71% in 2020/21.

Notable points from the graph are:

  • Big 6 clubs (Manchester City, Manchester Utd, Liverpool, Tottenham Hotspur, Arsenal and Chelsea) increased wages by 7%.
  • Manchester City has the biggest wage bill and revenue level.
  • Leicester were the biggest spenders outside the top 6
  • Fulham (relegated) and Crystal Palace had the highest wages/revenue ratio at 98% & 95%.
  • Sheffield Utd and Tottenham Hotspur had the lowest wages/revenue ratio at 49% & 57%
  • Both Sheffield Utd and West Bromwich Albion were relegated and spent the lowest on wages – £57m and £77m. Burnley was the next lowest at £86m but managed to avoid relegation by finishing 17th.
  • The big six accounted for 51% of EPL wage costs.
  • The wage gap between 6th place (Tottenham Hotspur) and 7th place (Leicester City) was £13m.
  • *Spearman’s correlation coefficient increased from 0.66 in 2019/20 to 0.87 in 2020/21 – means a stronger correlation between wages and league position.

*Spearman’s rank correlation measures the strength and direction of association between two ranked variables.

Source:

Deloitte “Annual Review of Football Finance 2022”

Sign up to elearneconomics for comprehensive key notes with coloured illustrations, flash cards, written answers and multiple-choice tests on Revenue and Costs that provides for users with different learning styles working at their own pace (anywhere at any time).
 

Most Premier League clubs make as much money as a branch of IKEA

With the recent World Cup in Qatar I thought I would share this post again on the Economics of Football. The David McWilliams podcast entitled ‘The Economics of Football’ in which he interviews Simon Kuper of Soccernomics fame, is particularly insightful. What he basically says is that the vast majority of clubs are not businesses and are not trying to make profits. They are pursuing trophies and with this intention spend what money they do make on buying the best players. If you look at the teams in the four English Divisions in 1921 there has been little change even when some clubs go bankrupt. As they are fan based institutions they seem to be unaffected by things like debt in a normal business. For example if a club (limited company) goes bankrupt you discard the old company and form a new limited company changing the name of the club (ABC City to ABC United) but playing at the same ground with the same strip etc. To put it in perspective a typical Premier League club is the size of a branch of IKEA.

Football clubs are huge emotional brands but not very big businesses. For example in 2019 Barcelona was the first club to made over $1bn in revenue but that equates to 0.02% of what Walmart made that year. The problem that football clubs have is how to monetise that passion for the club without affecting their fan base.

Bundesliga should be the richest league in Europe?
When you look at the economic indicators of the German economy – population size, income levels, GDP growth etc – it should be the league with the most money. Why is this not the case? The German FA doesn’t want foreign money coming into their clubs like Chelsea, Manchester City, Paris Saint-Germain etc. Also the German Bundesliga has a rule that over 50% of a club must be controlled by its supporters.

New breed of foreign owners and European Super League
The owners of Manchester United, Tottenham and Arsenal are more focused on making money out of the football club compared to others – Man City, Chelsea, PSG – whose owners want success at the expense of profit. This new breed of owner has come under a lot of pressure from the club’s supporters in that some are borrowing money to buy the club and then taking money out. Take for instance Man United – in the 5 years up to 2020, no owners in the Premier League have taken out more money than Man Utd £133m (dividends £112m, share buy back £21m). In stark contrast, some owners have put in significant funds: Everton £348m, Aston Villa £337m and Chelsea £255m – see graphic.

Source: SwissRamble

You can therefore see why some owners were keen on the European Super League. The proposed ESL was all but free-market capitalism with an American style franchise system with 12 teams guaranteed a place in the competition – significant barriers to entry and not conducive to competition. So much for Joseph Schumpeter’s creative destruction with a group of elite clubs protecting their market and the owners being rentier capitalists. The ESL’s proposed move is similar to what has been happening in the market place – a structure of businesses taking huge debt and taking little interest in competition as long as they are making money. Manchester United, probably the most famous club in the world, got knocked out of the Champions League in the group stage in 2021 but are still making a lot of money for the owners. It seems that the desire to win trophies has been superseded by profit – the proposed ESL avoids competition as member clubs are protected against the risk of failure. Not to say this is not already happening as the EPL and many other leagues in Europe are dominated by a small number of clubs which have significant funds available.

World Cup – is German Football like the German Economy?

I did a post on this topic earlier in the year but thought to update it with some recent data. In teaching economics I try and relate as much as I an to the interests of the students. I have found that sport is one way of engaging a class especially in the macro indicators of a country – growth, unemployment, inflation, trade, inequality etc. The German economy has been the backbone of the EU for a number of years but has this corresponded to the success/failure of the national football team? The performance at the 2004 Euros were the catalyst to an overhaul of the German coaching system – outlined brilliantly in Raphael Honigstein’s book – Das Reboot. This came to fruition in the 2014 World Cup final when German beat Argentina 1-0 in extra time.

However a year earlier in 2013 there was an all German final in the European Champions League with Bayern Munich defeating Borussia Dortmund 2-1 at Wembley Stadium in London. In order to get to the final both teams beat Spanish counterparts – Real Madrid and Barcelona. What is fitting is that in economic terms German is the powerhouse of the European economy whilst in contrast Spain has suffered greatly from the euro crisis and austerity measures that have been imposed on it. If you look at post-war Germany you can see some correlation between the success of the national side and state of the economy.

The Economist looked at this and made the point that German has opened up its borders to not just traditional labour but also football players. Of the two squads on show at the Champions League Final at Wembley in 2013, 17 were from outside Germany.

Most visibly, Germany opened up. Just as immigrants flock to German jobs (more than 1m net arrivals in 2012), so players join German clubs. Between them Bayern and Dortmund have four Brazilians, three Poles, a Peruvian-Italian, a Serb, a Croat, a Swiss of Kosovar extraction, an Austrian of Filipino/Nigerian stock, a Ukrainian and two Australians—and so on. Of the German players, several have dual citizenship or a “migration background”. If the choice is between a German Europe or a European Germany, as the novelist Thomas Mann once put it, football points to the second.

2014 onwards

The 2014 World Cup victory, almost 25 years since they last won it, was achieved largely through the restructuring of German coaching system. The style of play was transformed from a defensive minded ‘park the bus’ attitude to one of free flowing counter attacking style. However the economy was not as buoyant as in previous years with unemployment 6.6% and the spectre of deflation rising its head. Roll on the 2018 World Cup and the defending champions had a disastrous campaign with not even getting out of pool play. This coincided with weakest growth in Germany for five years. The Euro 2020 (played in 2021 because of covid) saw Germany going out to England in the last 16. With regard to the club scene Bayern Munich did win the Champions League in 2020 but no German team made it to the semi-finals in 2021 as both Bayern Munich and Borussia Dortmund were knocked out in the quarter finals.

As with most countries the German economy failed to return to its pre-covid growth rate as shortages of manufacturing inputs have hampered any recovery. However, there are plenty of orders on the books for German companies for a potential rebound when supply constraints ease. On the football side of things under new manager Hansi Flick, ex Bayern Munich, the national side breezed through qualifying for Qatar 2022 in what was a weak group, but are still ranked only 12th in the world which is an improvement on 16th in 2018.

2022 – recent results and economic outlook

Recently their poor run of form in the Nations league with just one win in six games and a home defeat to Hungary has left new manager Hansi Flick with a big challenge to get the best out of a talented squad. However, the lack of a real number 9 is a concern and although they can beat other teams it is their lack of consistency that could let them down. As for the German economy it is still a gloomy outlook – high inflation, constant supply chain problems and weaker global demand have impacted their manufacturing industry. Although unemployment figures are low there is pressure on wages which could put further pressure on inflation.

Sign up to elearneconomics for comprehensive key notes with coloured illustrations, flash cards, written answers and multiple-choice tests on macroeconomic indicators that provides for users with different learning styles working at their own pace (anywhere at any time).

The economics of transfer deals – Sevilla FC

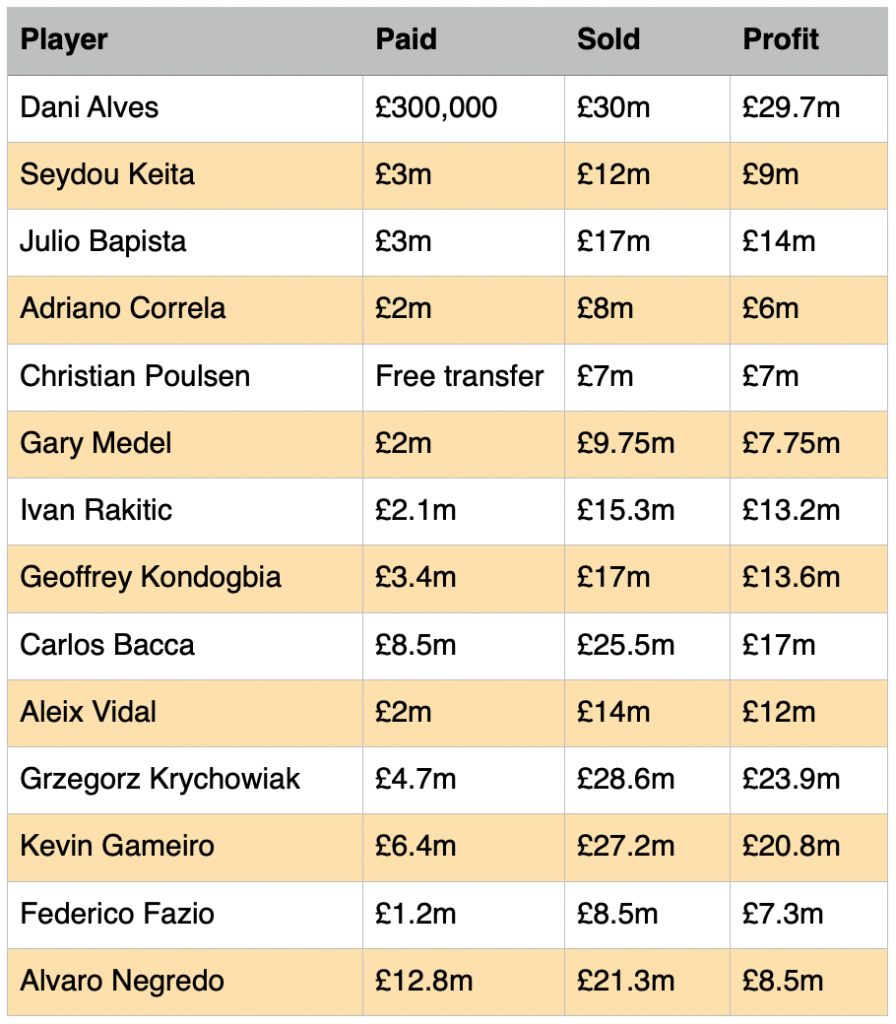
A colleague forwarded me link to the BBC sport website concerning the work of Ramón Rodríguez Verdejo aka Monchi. Monchi spent 11 years as player at Sevilla (goalkeeper) but is recognised more for his role at Sevilla’s sporting director. When appointed Sevilla were in the Spanish second division and Monchi studied clubs like FC Porto and Lyon who won titles but were able to sell top players and replace them with similar quality players for less money. His first signing was Dani Alves who six years later went to Barcelona for £30m a profit of £29.7m – other signings by Monchi are listed in the table below which equates to and overall £189.75m profit.

Sevilla was relegated from the top flight at the end of the 1996–97 season but returned to La Liga in 1999 with a policy of sell and grow. Since then they have won the following:

  • Copa del Rey in 2007 and 2010;
  • Uefa Cup in 2006 and 2007;
  • Europa League in 2014, 2015, 2016 and 2020.

Monchi pulled off another profitable transfer last season which saw Ivan Rakitic return to Sevilla for a second spell. Originally the Croatian was signed for £2.1m from Schalke in 2011 and then sold to Barcelona for £15.3m in 2014. In September this year Sevilla resigned him for £1.36m and still playing very good football at 32 years of age.

Do the new signings perform?

The website ‘Total Football Analysis’ looked at how well Monchi’s signings performed – this included five years at Sevilla (2012/13 to 2016/17) and two years at AS Roma (2017/18 to 2018/19) – he returned to Sevilla in 2000. His time at AS Roma was not as successful as at Sevilla.

How ‘Total Football Analysis’ judged the success of his signings was by using the metric: the percentage minutes played versus the price that was paid in the transfer market – see graph below. So logically the more expensive the signings the greater the minutes played. The players in red are AS Roma and those in blue are Sevilla FC.

Upper-left quadrant – poor signings as they are players with an above-average price (more than 7.63 million euros) who played below average minutes (39.24%).

Even if we are taking five seasons at Sevilla and only two at Roma, most of the players in the upper-left quadrant are Roma players. Only Ciro Immobile, Joaquín Correa and Paulo Henrique Ganso could be considered very bad signings for Sevilla in this period, while Roma in only two seasons had Patrik Schick, Javier Pastore, Grégoire Defrel, Rick Karsdorp, Cengiz Ünder, Davide Santon and Juan Jesus in the same list. 

Lower right quadrant – excellent signings. Those are players with a below-average price who played a higher than average percentage of minutes. This time, plenty of Sevilla players make the list, but only three Roma players: Aleksandar Kolarov, Federico Fazio and Nicolò Zaniolo.
Lower left quadrant – cheap but didn’t play much, which could mean they were supposed to play that role or were bad signings
Upper right quadrant – expensive signings who played a lot of minutes as there were high expectations.

The correlation between price and percentage of played minutes is represented with the green line. Curiously, the correlation is very low for Monchi’s signings, showing the price is a very bad predictor of players performances in his case. Part of this is because of his high spending at Roma on players who couldn’t make an impact. This reinforces what we suggested before: Monchi proved to be much better at signing lesser-known players for cheap fees than at making high-profile signings. 

World Cup – the economics of faking an injury.

With the end of a long first term (11 weeks) approaching I try to add a bit of humour to the classroom as generally people are tired and add to that the numerous disruptions to COVID. Later this year the football World Cup takes place in Qatar and I hark back to the last World Cup where we saw the same old tricks played by players to try and influence the decision of the referee.

  • France’s Lucas Hernandez admitted to flopping in France’s 2-1 win against Australia in an attempt to get Australian midfielder Mathew Leckie sent off.
  • Spanish defender Gerard Piqué accused Portugal’s captain Cristiano Ronaldo of exaggerating a fall to secure a penalty kick in their 3-3 nail-biter. Piqué said Ronaldo has a habit of “throwing himself to the ground.”
  • Neymar rolling around in what seemed to be excruciating pain when there was contact on his ankle and that was on the sideline. What would he have done if it was in the penalty area and Brazil were 0-1 down?

That being said it was hoped that the VAR system would start to see this sort of tactic removed from the ‘beautiful game’. Some of the techniques of faking an injury are below – HT to Kanchan Bandyopadhyay.

The Economist has looked at this area and I thought that I would delve a little deeper. There is no doubt that if you study the costs and benefits of faking an injury there are certain sports where it is perceived as quite worthwhile – i.e. the benefits outweigh the costs. Cost benefit analysis is part of Unit 3 of the AS Level course. What is cost-benefit analysis (CBA)?

Cost Benefit Analysis (CBA) refers to estimating the private and external benefits of an investment project – airport, rail link, road etc against the private and external costs. Once these costs/benefits are established a decision is made as to whether the project should go ahead.

CBA can be applied to any decision you make and below is a table outlining the cost and benefit of faking a peanalty or injury in particular sports. I see the benefit in soccer of diving in the box and being awarded a penalty outweigh the costs by a significant amount. Firstly, if the appeal for a penalty is turned down it is very unlikely that the referee will administer any punishment to the player faking a foul. In too many cases they are happy to let the game play on as they feel under so much pressure anyway for not awarding it. Whilst in ice-hockey a suspension of either 2 or 4 minutes has acted as a deterrent to those caught “embellishing”. I have put some values in the end column which will no doubt encourage a lot of discussion – remember Warren Gatland, the Welsh coach in the Rugby World Cup 2011, considered informing a player to fake an injury so there would be no pushing in the scrums. This was after their captain, Sam Warburton, was sent off early in semi-final against France.

However, with the perceived benefits of diving in soccer it does encourage players to even practice this activity. This reminded me of a great advertisement run by the Guardian Newspaper for the Euro 2004 Soccer Cup – see below

For more on Cost-Benefit Analysis view the key notes (accompanied by fully coloured diagrams/models) on elearneconomics that will assist students to understand concepts and terms for external examinations, assignments or topic tests.

How Roman Abramovich bought Chelsea Football Club.

I can recommend listening/subscribing to the David McWilliams podcast – an Irish economist who popularises economics and explains quite complex issues in understandable language. I might be a bit bias here being Irish. He recently held a live podcast to a sold out audience of 1,200 in the 3Olympia theatre in Dublin. This theatre is more used to rock concerts, plays etc so for an economist to have a sold-out gig is quite impressive. Colin Peacock of Radio New Zealand recently interviewed him on Radio New Zealand

A recent podcast looked at Russia and how the oligarchs got their money – he used the example of Chelsea Football Club owned by Russian Oligarch Roman Abramovich. Below is a mind map and a timeline of events.

  • 1990 – Germany reunites – fall of Berlin Wall
  • 1991 – Yeltsin – first president of Russian Federation
  • 1992 – ‘Shock therapy’ economic reforms – spiralling inflation
  • 1992 – Massive privatisation programme of state assets- every citizen 10,000 ruble voucher
  • 1993 – Oligarchs bought vouchers off confused public – very cheap
  • 1996 – Yeltsin offers oligarchs (22 individuals) key state assets (40% of country) for media support and financing re-election
  • 1997 – Government tries to curtail ‘sweetheart deals’ with oligarchs
  • 1997 – Oligarchs get money out of Russia – buy yachts, property, companies, football teams etc
  • 1999 – Yeltsin steps down and Putin becomes prime minister – the rest is history

Estimates of oligarchs worth outside Russia

  • $920bn of net private Russian wealth located offshore
  • $2bn stake in the London property market
  • $11bn in Swiss bank accounts500
  • Russian multimillionaires living in the UK

2020 report from the Atlantic Council on Russian dark money, Vladimir Putin and his closest associates control around one-quarter of the estimated $1 trillion worth of assets stashed away in the West and beyond Russia’s borders. Source: David McWilliams Podcast

For more on economic systems view the key notes (accompanied by fully coloured diagrams/models) on elearneconomics that will assist students to understand concepts and terms for external examinations, assignments or topic tests.

Sunk Costs, Market Structure and Football Clubs

Over the holidays I read Stefan Szymanski’s book “Money and Football – A Soccernomics Guide”. Szymanski also co-authored “Soccernomics” with Simon Kuper. There were various references to economic theory through the book which I will refer to on this blog.

Market Dominance

Dominance in a market is often associated with the lack of competition whether it be due to monopoly power, predatory pricing, the scale of investment etc. However this is not the case when it comes to football. Szymanski mentions the fact that there are 27 professional teams withn a 50 mile radius of Manchester Utd. If fans don’t like United, there are plenty of alternatives as there are in Madrid which has 5 professional clubs. In some countries football rivals play in the same stadium:

  • In Germany: Bayern Munich and TSV 1860 Munich,
  • In Italy: Inter Milan and AC Milan,
  • In Switzerland: FC Zurich and FC Grasshopper
  • In Brazil: Botafogo, Flamengo and Fluminense

Football Clubs.jpgDominance in markets usually occurs because of the initial investment required to compete in the first place – set-up costs. If you look at the railway industry (which could be said to be a natural monopoly) the cost of putting down new train tracks by the existing ones or a new line would be excessive and the ability to cover these costs would very difficult. Any benefit that may arise from competition would be diminished by the cost of duplication.

Dominance is easy to explain if there are very large set-up costs, which, once spent, cannot be recovered other than by operating in the industry. Economist refers to these costs as Sunk Costs.

Dominance in a market can also occur in markets where there are less sunk costs. Take for instance the soft drinks industry as an example. It remains relatively inexpensive to set-up a production plant to bottle soft drinks but Coca-Cola dominates the world market with 42% market share, followed by Pepsi with 28%. Their dominance is through advertising which makes up the majority of the sunk costs. Advertising is an example of ‘endogenous’ sunk costs which are determined by the firm as opposed to ‘exogenous’ sunk costs which are determined by technological requirements.
Premier League Players.jpgIn professional football the focus is on player investment rather than advertising, where the big clubs are those that spend heavily on players and win league championships. Teams that win are more likely to attract a larger fan base and greater revenue. Szymanski states that the big difference between football and soft drinks is that the pattern of dominance looks the same in small markets. For instance clubs in the English Division 2 (Division 4 in the old days) still stay in existence mainly because they operate in a different market than the Premiership teams. Of the 88 clubs in the English Football League in 1923, 85 still exist, and most of them still play in the 4 English Divisions. Also those clubs in the lower Division do benefit from intense local loyalty especially through tough times with performance. When clubs get relegated to the Championship from the Premier League, although they lose revenue from TV rights their fan base remains fairly constant. However a lot of these clubs will find it hard breaking into the dominant group – Manchester City, Manchester Utd, Liverpool, Arsenal, Chelsea, Spurs – unless they receive significant funding from an investor who doesn’t expect to see a financial return or have an exceptional season without high profile players like Leicester City who won the Premiership in 2015/16.
Unlike most business in which loss-making firms shut down or merge into other businesses, football clubs almost always survive. This does not prevent dominance, but unlike most industries, it does mean that the pattern of dominance tends to look the same everywhere. Source: Szymanski

Globalisation of the football labour market = demise English National side?

EPL foreign playersGreg Dyke, the chairman of Football Association, has stated in the media that the English Premier League and Championship are not giving young domestic talent sufficient opportunities at the highest level of English football. He declared that the EPL was gravitating towards being “owned by foreigners, managed by foreigners and played by foreigners.”

Football has one of the most globalized markets for skilled labour and the EPL has embraced the benefits of open borders. Greg Dyke’s concern is plain to see:

There are 500 player jobs in the EPL – 20 teams x 25 players
1990’s – 345 (69%) of the 500 player jobs were filled by English players
Today – 185 (37%) of the 500 player jobs are filled by English players

This is contrast to the La Liga (Spanish League) where 61% of the players were Spanish and 59% of the Bundesliga (German League) were German. It is ironic that both the national sides of Spain and Germany have been most successful in recent times:

Spain – European Champions – 2008 and 2012. World Cup Winners 2010
Germany – World Cup Winners 2014.

Furthermore in the English second tier, the Championship, has seen English players account for less than 50% of the total minutes played during the early months of the current season as calculated by the BBC.

Solution to the English Game
Dykes has lobbied government to impose new limits on the supply of foreign players, by making it harder to get work permits. Furthermore he wants to somehow persuade teams to contract more English players in their squads of 25. In economics this is know as import substitution as Dykes is trying to encourage the development of the domestic industry by imposing protectionist policies. But as pointed out by the New York Times, England is not developing a new industry as football was invented there.

Are foreign players bad for the English game?

The money that it brings into the economy through sponsorship, television rights, shirt sales etc, is significant. Furthermore the English players that do play in the EPL are much better off that their predecessors:

2014/15 season – EPL average salary = £2.3 million
2014/15 season – Championship salary = £486,000
1992/93 season – average salary = £140,000 (adjusted for inflation)

Although fans are arguably watching a very high standard of football in the EPL it is ironic that no side from the EPL made the Quarter-Finals of the European Championship.

The Global Game
Globalisation has increased the competitive balance of international competitions like the World Cup, as players from smaller and less affluent countries, such as Ghana and Uruguay, have more opportunities at the game’s highest levels. That suggests England and other traditional powers are losing ground, in relative terms, because they now face stiffer competition.

Source: New York Times – Globalisation Under attack, on the Soccer Field.

World Cup defeats = declining Stock Markets

London Business School Professor Alex Edmans has written an academic paper with Diego Garcia and Oyvind Norli which shows that international football defeats lead to declines in the national stock market index.

Edmans on his blog looked at how this theory has played out in the 2014 World Cup. There has been evidence of stock market declines after defeats in this World Cup. Across all countries with a stock market index, a defeat has led to the index falling by 0.2% faster than the MSCI World index. Moreover, defeats by the “big seven” countries (notably England, Spain, and Italy) have led to declines of 0.5%. Out of the 36 defeats by countries with an active stock market, 24 have been followed by market declines faster than the MSCI World. Below is data from Edmans’ blog and a humourous talk about his paper.

World Cup Results and Stock Markets

Avoid the Germans in a Penalty Shootout

A particular interest of mine is game theory and penalty shootouts – see Game Theory Lesson: Man Utd v Chelsea Penalty Shootout. This involves studying the alternative strategies a person may choose to adopt depending on their assumptions about their rivals’ behaviour. The most significant research into penalty kicks has been done by Steven Levitt (co-author of Freakanomics) who co-authored a paper on mixed strategies when players are diverse in their decision making and studied 459 penalties in the Spanish and Italian leagues. Another economist Ignacio Palacios-Huerta analysed 1417 penalty kicks from several European countries during the period 1995-2000.

Approaching the business end of the Football World Cup and you have to have some sympathy for the Costa Ricans who celebrated after extra-time with the scores being tied – assuming that this was their plan from the commencement of the game and that they fancied their chances in the shootout. However why do some teams do better at penalty shootouts than others? The Economist looked at this recently and came up with the following:

1. Defeat is habit forming – players who miss regularly become fatalistic
2. Countries that are collectivist in nature rather than individualistic do much better – mindful of their public image
3. Research shows that star players tend to miss more than your average player – they feel the pressure
4. Who goes first is important as players are far more likely to miss a penalty if it to stay in the contest rather than one that will win it. The majority of the time the team going first wins the shootout.

Below is a chart from The Economist which shows that England have struggled at this part of the game but the Germans, as you would expect, are very efficient. As for the Czech Republic they have yet to miss a penalty.

Penalty Shootout stats

Psychological Preparation for Penalty Shootouts – Academic Paper

A recent piece of research from the British Association of Sport and Exercise Sciences addresses how you should prepare for Penalty Shootouts.

Players who take less than one second to place the ball on the penalty spot score on about 58% of their penalties whereas those who take longer score on about 80% of their penalties (Jordet et al., 2009).

Similarly, taking about a second or more to respond to the referee’s whistle to initiate the shot is associated with a higher probability of scoring than immediately rushing towards the ball (Jordet et al., 2009).

Developing and practising a suitable pre-shot routine is a potentially useful way to guide these timings and help protect performance under pressure. Indeed, recent research by Wood and Wilson (2012) has suggested that learning a routine involving a gaze control element (look at the point where you want to shoot prior to the run-up) helped penalty takers in a shootout task to be more accurate, maintain effective visuomotor control and increase perceptions of psychological control and contingency.

In the Shootout:

1. Don’t rush: Place the ball properly on the spot and take a breath while focusing on where you intend to shoot, before starting the run-up. Taking a deep breath is likely to ease feelings of anxiety and provides a temporal cue to ensure that sufficient processing of target-related information is enabled.
2. Trust your technique and routine – pick a spot and hit it.
3. Celebrate! It will help your team-mates who have to take the subsequent penalty kicks.

With the semi-finals coming up you’ve got to fancy the Germans if it goes to a penalty shootout.