Business cycle or volatile booms and busts? The four stages of the bubble.

I blogged on this topic last year but below is a useful video from the Wall Street Journal (WSJ) on how bubbles are so difficult to predict with some examples from Gamestop to Tulips. A graphical explanation follows after the video.

I picked up this graphic and explanation from The Geography of Transport Systems by Jean-Paul Rodrigue (2020)

It is apparent that business cycles aren’t those smooth ups and downs as depicted in a lot of textbooks but more volatile with booms and busts. Central banks appear to play their part in this process with the low cost of borrowing feeding the boom phase of the cycle. Instead of economic stability regulated by market forces, monetary intervention creates long-term instability for the sake of short-term stability.

Bubbles (financial manias) unfold in several stages, an observation that is backed up by 500 years of economic history. Each mania is obviously different, but there are always similarities; simplistically, four phases can be identified:

  • Stealth – emerging opportunity for future prize appreciations of investments. Investors have better access to information and understand the wider economic context that would trigger asset inflation. Prices tend to increase but are unnoticed by the general public.
  • Awareness – many investors start to notice the momentum so money starts to push prices higher. There can be sell-offs but the smart money takes this opportunity to reinforce its existing positions. The media start to notice that this boom benefits the economy.
  • Mania – the public see prices going up and see this a great opportunity to invest with the expectations about future appreciation. This stage is not so much about reasoning but psychology as money pours into the market creating greater expectations and pushing prices up. Unbiased opinion about the fundamentals becomes increasingly difficult to find as many players are heavily invested and have every interest to keep asset inflation going. At some point, statements are made about entirely new fundamentals implying that a “permanent high plateau” has been reached to justify future price increases; the bubble is about to collapse.
  • Blow-off – everyone roughly at the same time realises that the situation has changed. Confidence and expectations encounter a paradigm shift, not without a phase of denial where many try to reassure the public that this is just a temporary setback. Many try to unload their assets, but takers are few; everyone is expecting further price declines. Prices plummet at a rate much faster than the one that inflated the bubble. Many over-leveraged asset owners go bankrupt, triggering additional waves of sales. This is the time when the smart money starts acquiring assets at low prices.

For more on the Business Cycle view the key notes (accompanied by fully coloured diagrams/models) on elearneconomics that will assist students to understand concepts and terms for external examinations, assignments or topic tests.

Short-selling explained – ‘Trading Places’ movie

The 1983 movie ‘Trading Places’, staring Eddie Murphy and Dan Aykroyd tells the story of an upper class commodities broker Louis Winthorpe III (Aykroyd) and a homeless street hustler Billy Ray Valentine (Murphy) whose lives cross paths when they are unknowingly made part of an elaborate bet.

There is a great part in the movie when they are on the commodities trading floor that explains price and scarcity. Winthorpe and Valentine are up against the Duke Brothers in the Frozen Concentrated Orange Juice (FCOJ) futures market.

How a futures market works
As opposed to traditional stock/shares futures contracts can be sold even when the seller doesn’t hold any of the commodity. For instance a contract of $1.30 per pound for a 1000 pounds of FCOJ in February indicates that the seller is compelled to provide the produce at that time and the buyer is compelled to buy the produce.

Here’s how it worked in the movie

The Duke Brothers believe they have inside knowledge about the crop report for the orange harvest over the coming year. They are under the impression that the report will state the harvest will be down on expectations which will necessitate greater demand for stockpiling FCOJ – this will mean more demand and a higher price. Therefore at the start of trading the Dukes representative keeps buying FCOJ futures. Others saw they were only buying and wanted in on the action, those that had futures were not willing to sell so the price kept rising. However the report was fake and Winthorpe and Valentine had access to the genuine report which stated that the orange harvest had not been affected by adverse weather conditions. Knowing this they wait till the the price of FCOJ reaches $1.42 and start to sell future contracts.

Then when the crop report is announced and it indicates a good harvest investors sell their contracts and the price drops very quickly. The Dukes are unable to sell their overpriced contracts and are therefore obliged to buy millions of units of FCOJ at a price which exceeds greatly the price which they can sell them for. In the meantime Winthorpe and Valentine for every unit they sold at $1.42 they only have to pay $0.29 to buy it back to fulfill their obligation. This results in a profit of $1.13 per unit.

Wall Street and Main Street – the disconnect.

Excellent video from The Economist regarding the disconnect between Wall Street and Main Street i.e. Stock Market and the Economy. The S&P 500 is up 38% since the middle of March this year when the US economy has been going through one of its worst recessions. The US Federal Reserve had a role here by providing aid packages so the increase in the S&P was seen as a Fed rally and not from normal fundamentals.

What would US$10,000 invested in 2015 have yielded by 2020?

Just finished reading the book ‘The New World Economy – A Beginner’s Guide’ (2020) by Randy Charles Epping – a recent addition to the King’s College library. It is particularly good for those students who are new to the subject and it explains current issues in a very understandable language. It looks at:

Bitcoin – Economic Crisis to Global Crisis – Ranking Countries – Brexit – Globalisation – Inflation vs Deflation – Hot Money – AI – BRICS – Inequality – Tax Evasion – Climate Change – China – Trade Wars and many more economic issues.

One table I found interesting was the return of US$10,000 over the last five years – see table below. Bitcoin has been incredible but stay clear of Argentinian stocks.

Source: The New World Economy – A Beginner’s Guide (2020) by Randy Charles Epping

‘Trading Places’ movie – short-selling explained

The 1983 movie ‘Trading Places’, staring Eddie Murphy and Dan Aykroyd tells the story of an upper class commodities broker Louis Winthorpe III (Aykroyd) and a homeless street hustler Billy Ray Valentine (Murphy) whose lives cross paths when they are unknowingly made part of an elaborate bet.

There is a great part in the movie when they are on the commodities trading floor that explains price and scarcity. Winthorpe and Valentine are up against the Duke Brothers in the Frozen Concentrated Orange Juice (FCOJ) futures market.

How a futures market works
As opposed to traditional stock/shares futures contracts can be sold even when the seller doesn’t hold any of the commodity. For instance a contract of $1.30 per pound for a 1000 pounds of FCOJ in February indicates that the seller is compelled to provide the produce at that time and the buyer is compelled to buy the produce.

Here’s how it worked in the movie

The Duke Brothers believe they have inside knowledge about the crop report for the orange harvest over the coming year. They are under the impression that the report will state the harvest will be down on expectations which will necessitate greater demand for stockpiling FCOJ – this will mean more demand and a higher price. Therefore at the start of trading the Dukes representative keeps buying FCOJ futures. Others saw they were only buying and wanted in on the action, those that had futures were not willing to sell so the price kept rising. However the report was fake and Winthorpe and Valentine had access to the genuine report which stated that the orange harvest had not been affected by adverse weather conditions. Knowing this they wait till the the price of FCOJ reaches $1.42 and start to sell future contracts.

Then when the crop report is announced and it indiates a good harvest investors sell their contracts and the price drops very quickly. The Dukes are unable to sell their overpriced contracts and are therefore obliged to buy millions of units of FCOJ at a price which exceeds greatly the price which they can sell them for. In the meantime Winthorpe and Valentine for every unit they sold at $1.42 they only have to pay $0.29 to buy it back to fulfill their obligation. This results in a profit of $1.13 per unit.

Crash Course Economics – YouTube channel

Here is a useful YouTube channel called Crash Course Economics. The presenters are Jacob Clifford (you may remember him from the Star Wars clips) and Adriene Hill. There are currently 11 videos on a range of topics – economic systems, budget deficits, money and finance etc. Most are around 10 minutes long but well structured. Below is a very good presentation on Inflation and Bubbles and Tulips.

Stock Market Returns and the Weather

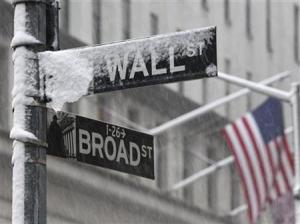
Snow covers a street sign at the corner of Wall St. and Broad St. in New York's financial districtAn interesting paper by Ming Dong, Andréanne Tremblay of York University, Toronto investigated the effects of five weather conditions (sunshine, wind, rain, snow depth, and temperature) on daily index returns of 49 countries from 1973 to 2012.

The effects of the weather on mood depend critically on geographical regions, and more precisely, on regions defined by their annual average temperature. The emotional effects of other weather variables may be also specific to the temperature region – in hot countries rain might seen as a positive whilst in cold climates rain could be seen to exacerbate the cold climate. However they make two assumptions:

1. Comfortable weather should lead to an upbeat investor mood and therefore high stock returns.
2. The weather effects on returns should be stronger when people spend more time outdoors or when outdoor time is more valuable.

Here are some of their findings:

Cold Countries

In the cold region, the positive sunshine effect on returns concentrates in the summer, when investors spend more time outdoors, and in late winter and early spring, when the marginal utility of outdoor experience may be particularly high after a long winter. However very cold weather is also associated with higher returns which suggest that cold stimulates risk-taking, referring to psychological studies in which participants reported increased aggression as temperatures dropped below -8 degrees C.

Hot Countries

Sunshine has a positive effect on returns during the warmer portion of the year, from May through September—but not June or July, presumably because the scorching sun compromises the outdoor time during peak heat. The sunshine effect is also strong from December to February, consistent with the idea that sunshine brings pleasant warmth during the winter when people still spend considerable time outdoors.

Mild Countries

Stock returns and temperature are strongly negatively correlated in the winter (from December to February). This finding is incompatible with the comfortable weather hypothesis, because it is unlikely that during winter times in the cold region, lower temperature leads to happy mood.


Overall

1. The effects of the weather on stock returns depend critically on the temperature environment, which is characterised by geographical region and month of the year.

2. All five weather conditions significantly influence returns, especially during seasons when people expect to spend, or highly value, time in the outdoors.

World Cup defeats = declining Stock Markets

London Business School Professor Alex Edmans has written an academic paper with Diego Garcia and Oyvind Norli which shows that international football defeats lead to declines in the national stock market index.

Edmans on his blog looked at how this theory has played out in the 2014 World Cup. There has been evidence of stock market declines after defeats in this World Cup. Across all countries with a stock market index, a defeat has led to the index falling by 0.2% faster than the MSCI World index. Moreover, defeats by the “big seven” countries (notably England, Spain, and Italy) have led to declines of 0.5%. Out of the 36 defeats by countries with an active stock market, 24 have been followed by market declines faster than the MSCI World. Below is data from Edmans’ blog and a humourous talk about his paper.

World Cup Results and Stock Markets

Stockmarkets on the rise

Stockmarkets are starting to reap the benefits of significant quantitative easing and record low interest rates by Central Banks worldwide. In the US for instance there have been three doses of QE and the Federal Reserve indicated that they will keep rates low until 2015 as well as buy $40bn worth of mortgage backed securities.

But this is not the primary reason for the positivity in markets. Central Bank interest rates form the basis of global rates in trading banks, bonds etc. and with 10-year Government Bonds, which is considered a safe investment, at low yield levels investors are looking elsewhere for greater returns on their money. Even Bond rates in the struggling economies of Europe have dropped (Table 1). This indicates that investors are more comfortable about these economies in that the country doesn’t have to offer higher yields on Bonds to attract investors. With this low return on the Bond market investors are attracted to the higher yields on stock markets (Table 2).

Bond and Staockmarkets 2013

____________________________________________________________

The above is a brief extract from an article published in this month’s econoMAX – click below to subscribe to econoMAX the online magazine of Tutor2u. Each month there are 8 articles of around 600 words on current economic issues.

econoMAX

Stockmarkets v 10 Year Government Bonds

Stockmarket v BondsHere are some statistics that I got from the New Zealand Herald that show investment in the stockmarket has been outperforming 10 year government bonds. The table below shows Bond rates v stockmarket dividend yields over the last 12 months to May 2013. Investors seem to be more comfortable about European economies as they don’t have to offer higher yields on Bonds to attract investors. The countries that have seen a significant drop in rates are Greece, Portugal, Spain and Ireland. Also note the very low interest rates which threatens a liquidity trap. This is a situation where monetary policy becomes ineffective. Cutting the rate of interest is supposed to be the escape route from economic recession: boosting the money supply, increasing demand and thus reducing unemployment. But John Maynard Keynes argued that sometimes cutting the rate of interest, even to zero, would not help. People, banks and firms could become so risk averse that they preferred the liquidity of cash to offering credit or using the credit that is on offer. In such circumstances, the economy would be trapped in recession, despite the best efforts of monetary policy makers.

Stockmarkets then and now – 2007 – 2013

Here is yet another graphic from The Economist showing the change in stock markets since the peak before the financial crisis in 2007/8. Although Dow Jones Industrial Average surpassed its previous peak (though it is still around 7% off once inflation is taken into account) – see previous post. As you can see some stockmarkets are still struggling and Greece is more than 80% below its peak in 2007.

Stockmarkets

Wall Street: DJIA surpasses high in October 2007 but not in real terms

The media last week were championing the fact that America most-cited benchmark, the Dow Jones Industrial Average (consists of the biggest 30 companies on Wall Street), had surpassed the peak that it reached prior to the Global Financial Crisis in 2008. Although the DJIA has doubled since March 2009 the American economy has only grown over the same period by 7% in real terms. Ultimately there is no real correlation between GDP growth and stock market returns The Economist stated main reason for this is that central banks worldwide have been forcing down the returns on Government bonds hoping to get investors to put money into more risky assets and therefore restore confidence amongst businesses and consumers.

Do the figures stack up?

Although the DIJA has hit a record high numerically, has inflation been factored into the calculation? If you look at the real figures (adjusted for inflation) the Dow Jones is approximately 9% below where it was in October 2007. Therefore the purchasing power of your shares in October 2007 is greater than that of today.

In real terms DIJA would be around 12,900 instead of the peak of 14,253.77 on Tuesday 5th March.

Justin Lahart in the Wall Street Journal stated last week that when you included the dividends earned (with investments in the DIJA) over the past five and half years and if they were reinvested the DIJA would be at 16,000. Adjusting for both inflation and dividends would put the DIJA around 15,000 – up approximately 5%.

Another consideration that he alluded to was that the DIJA doesn’t really reflect how well the average stock is doing. Companies with high market capitalisations like Apple are worth more than others also stocks like International Business Machines are worth more than others. Therefore stocks with the largest weightings have tended to weigh on the DIJA. If you put all stocks on the same footing since DIJA’s old record, and the index would have performed much better. The equal-weighted DIJA now stands at 16,683.44 which is 2,518.91 points higher than its 2007 high of 14,164.53 – see graph below.

DJIA

Dow Jones Election Indicator

I like this Election Indicator from the NYT which suggests that a healthy performing Dow Jones Industrial Average (DJIA) usually means victory for the incumbent party in the US election. Their chart ranks 28 presidential terms since 1900 – part of the chart is below – complete chart can be found at “US Presidential Stock Markets”.

When the DJIA has risen more than 5% a year the incumbent party has won the election on 11 occasions to losing on 3. When the market fell below a 5% growth rate the incumbent party has lost 8 out of 13 elections.

Obama has been doing well with a compound annual gain of 8.8%.

Markets after disasters

From The Economist Daily Chart series. An interesting picture of how local stockmarkets reacted to the aftermath of a national disaster.

2011 Japan Earthquake – The Nikkei 225 – 17.5%↓
2001 USA Terrorist attacks – S&P 500 -11.6%↓
1995 Kobe Earthquake – Nikkei 225 – 7.6%↓

However while this earthquake was, to a certain extent, a forseen event – remember Japan has a history of earthquakes – the damage to the nuclear power station was not. Some commentators have likened this to a Black Swan – see previous posting: 2011 Black Swans. The Black Swan has three characteristics:
1. its unpredictability;
2. its massive impact; and
3. after it has happened, our desire to make appear less random and more predictable than it was.

One wonders if this disaster has given the US Federal Reserve a key reason to undertake further Quantitative Easing 3 (QE3)?