Are four-day working weeks the future?

There has much debate around the benefits of the four-day working week for both employees and employers. Research which was co-ordinated by a not-for-profit organisation, 4 Day Week Global, with employers in Ireland, the United States, Australia and New Zealand taking part. The UK had the biggest single-country trial in 2022 (Covid-19) which involved 73 companies and 3,300 employees. The Statista graphic below shows the results of the study which mainly focuses on productivity.

Why do economies put significant emphasis on boosting productivity?

  • Higher wages – with greater output per unit of input firms can offset the effect of wage increase on profits.
  • Lower prices – with productivity increasing businesses can pass on lower prices to consumers, although whether this actually happens is another story.
  • Higher profits – with productivity going up businesses can increase in their profits which means more money can be reinvested into the firm
  • Higher potential growth – higher productivity is the main driver of living standards and shifting the production possibility curve (PPC) outwards.

Other data from the research

  • Declining levels of stress, burnout and general fatigue
  • Better physical and mental health and work-life balance
  • Although some still worked on their day off, most felt more productive
  • Greater levels of exercise and sleep
  • Male workers spent more time looking after their children – up by 27%.
  • One less day at work meant less commuting time and therefore less environmental impact

Juliet Schor, an economist and sociologist at Boston College and lead researcher at 4 Day Week Global argues that a shorter working week is key to achieving the carbon emissions reductions the world needs. Click here to listen to her interview on the IMF podcast series ‘Women in Economics” Juliet Schor on the Benefits of the 4-day week.


Although climate benefits are the most challenging thing to measure, we have a lot of research showing that over time, as countries reduce hours of work, their carbon emissions fall. A 10% reduction in hours is associated to an 8.6% fall in carbon footprint” according to a study co-authored by Schor in 2012

Source: Four-day work week trial in Spain leads to healthier workers, less pollution. WEF. Oct 25, 2023

For more on the Labour Market view the key notes (accompanied by fully coloured diagrams/models) on elearneconomics that will assist students to understand concepts and terms for external examinations, assignments or topic tests.

New Zealand’s poor productivity record won’t help inflation

Productivity refers to the rate of output per unit of input. For an economy to increase output it can either increase its factors of production or combine them in a way that is more efficient – greater productivity. The latter is the key to boosting per-capita incomes and overall living standards.

Compared to the OECD New Zealand has been a poor performer with labour productivity averaging around 1% per annum since the early 1990’s but the small size of the economy and its isolation remain significant barriers. More inputs of factors of production have been required to generate the same amount of output which suggest that we are working harder but not smarter. As in many other OECD economies, labour productivity growth in New Zealand declined after the global financial crisis, to about a half of the pre-crisis rate – see graphic from OECD.

New Zealand’s productivity has struggled to keep apace with other OECD countries and is around 20% below the average. Its real GDP per hours worked is 40% below the US and 30% below Australia. The OECD have indicated that there are reasons for this poor productivity record namely a lack of international connection, a mismatch of skills in the labour force and low rate of capital investment / R&D.

Productivity is a way of reducing inflation by increasing output per unit of input. But if New Zealand is unable to improve its productivity performance inflation will only slowly subside. This means a contractionary monetary policy (higher interest rates) from the RBNZ will remain in place for longer.

Source: OECD Economic Surveys New Zealand – January 2022

Sign up to elearneconomics for comprehensive key notes with coloured illustrations, flash cards, written answers and multiple-choice tests on Inflation that provides for users with different learning styles working at their own pace (anywhere at any time).

OECD – GDP per capita – New Zealand falls to 22nd.

New Zealand has enjoyed a high standard of living and solid economic growth in recent years. However, during this period New Zealand has also exhibited a comparatively low level of productivity growth relative to our OECD peers. Broad-based evidence of this can be seen in New Zealand’s Gross Domestic Product (“GDP”) per capita. This metric measures output per New Zealander and is standardised into US Dollars for all countries. On this metric, New Zealand has consistently trailed the United States, Australia, Canada, Great Britain, France, Japan and the OECD average.

In 2017, New Zealand was ranked 22 of 48 countries surveyed by the OECD, compared with 9th place in 1970 and 20th in 1993. Over the last 50 years the world has seen much stronger growth in exports of manufactured products and slower growth in exports of primary products. And New Zealand’s competitive advantage is still in primary products. We are now on the brink of a technological revolution that will alter the way we live and work. The fourth industrial revolution is all about embracing the digital revolution. Our low productivity levels are a bit of a conundrum and the reasons for this are varied and subjective. Source – ANZ Bank

OECD GDP PER CAPITA (2017)

Source: Organisation for Economic Co-operation and Development (“OECD”)

Are smartphones causing a loss of productivity?

A recent article on the Bank of England blog written by Dan Nixon caught my attention as it is something that I have long been concerned about – that is the amount of time we spend on our phones / devices and its impact on people’s productivity in the workplace.

Smartphone use and the amount of notifications that we get is enormous. Research in 2015 found that on average we check our 150 times a day – roughly 6½ mins – and spend 2½ hours each day on the phone, spread across 76 sessions. From this the ‘attention economy’ emerges as a scarce and valuable resource and is seen as one of the greatest problems of our time – American philosopher William James noted, our life experience ultimately amounts to whatever we had paid attention to.

The attention economy and the workplace.

The graph below makes for interesting interpretation – productivity growth has been very weak whilst shipments on smartphones has increase by 10 fold. You would expect that the output of a worker would depend on his/her ability to focus and be able to pay attention to the task in hand. However research into observing inner states (attention) and mapping those outcomes with attention (productivity) is fraught with difficulty.

Cyberslacking – The US Chamber of Commerce Foundation finds that people typically spend one hour of their workday on social media – rising to 1.8 hours for millennials. Another survey, meanwhile, found that traffic to shopping sites surged between 2pm to 6pm on weekday afternoons. An influx of emails and phone calls, for example, is estimated to reduce workers’ IQ by 10 points – equivalent to losing a night’s sleep.

Frequent distractions – might lead to a persistently lower capacity to work, over and above the direct effects. What is the argument for this being the case?

1. There’s habit formation – what we do is designed by smartphone apps which make us be as addictive as possible – to ‘hijack the mind’, as Tristan Harris puts it. The psychological mechanism at play here – “intermittent variable rewards” – is the same as the one that gets people hooked on slot machines.

2. The more choice of notifications we have the more time we will spend scanning them looking for instant gratification. Cal Newport goes so far as saying that media like email, far from enhancing our productivity, serve to ultimately deskill the labour force.

Algorithms and attention
Ultimately what we look at is determined by algorithms – so the more technology the less we make the decisions ourselves and our suggested we buy certain goods or services because of out previous behaviours. There has been a lot of talk about artificial intelligence and machines that will be capable of an increasingly wide set of tasks. But most agree on the need to cultivate our distinctively human skills in order to differentiate ourselves from machines. And the human ability to empathise – central to the work of social workers, performers and nurses, among others

But is technology all bad?

IT does help business for the following reasons:

  • Speeds up communication
  • Allows documents to be shared remotely
  • Easier to find information own the Internet.

From the above productivity surged in the late 1990’s and early 2000’s as email, databases and the Internet have had a significant effect on the productivity of business processes.

Is the cause of weak productivity distraction?

Distraction is not the whole story with regard to weak productivity. Industries such as manufacturing and construction have had disappointing productivity rates but this can hardly be due to workers being on their smartphones. As pointed out by The Economist ‘Free Exchange’ productivity is also a consequence of the movement of workers from industries with relatively high rates of growth to more stagnant ones. For instance in the US productivity half of total employment growth since 2000 has been in low productivity areas such as education and health care.

Final thought

According to Dan Nixon constant notifications results in workers becoming less empathetic which is a serious side-effect in an economy where human connections with customers are cast as a defense against automation. Distraction also appears to reduce happiness which ultimately impact on worker productivity. Must end this post now – better check my email accounts, twitter, Facebook and Linkedin.


Sources: 

Dan Nixon – Bank Underground blog

Free Exchange – The Economist.


Motivating workers with emotion – Dan Ariely interview on PBS

Below is a recent clip from Paul Solman of PBS who interviewed Behavioural Economist Dan Ariely. Ariely states that behaviour is driven by emotion not rewards like money; the ability to help other people, feel that we’re useful, feel that we’re getting better or living up to our potential are much stronger motivators than cash. The interview discusses an experiment that he at a computer chip production line in Israel. Workers who made their chip quota got either

  • $30
  • Voucher for pizza to take home to the family
  • A“well-done” text from the boss.

In the actual experiment, workers who made the quota and received the $30 and those that got a pizza voucher and the group that got a compliment were all more productive than workers who received nothing.

But, on the second day, when the workers who got the $30 were not paid a bonus, regardless of how many chips they turned out, their productivity actually dropped below those who got nothing.

In total, by giving people $30 bonus, Intel lost almost 5 percent of productivity. That’s a lot. Now, think about it. You give money because you think this would increase motivation. It actually decreases motivation.


Productivity painfully slow in developed countries

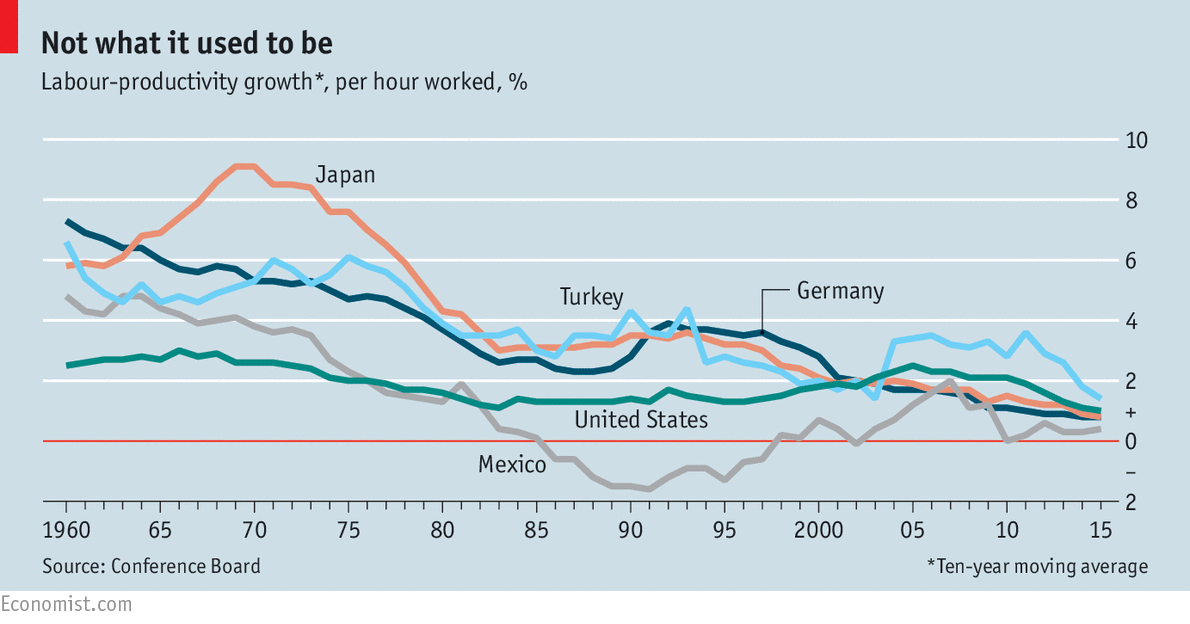
The Economist ‘Free exchange’ had a piece on productivity and how it has been rather stagnant in the rich countries. Since the 1960’s rates have dropped (except for Japan in 1970’s) and economist are suggesting that this has contributed to such low wage increases. Explanations for this problem fall into three categories:

1. Robert Gordon (Northwestern University) suggest that humanity has run out of big ideas. Inventions of the early19th and 20th centuries (electricity, indoor plumbing etc) have had a much greater impact on productivity than those of recent technological advances. However it was software and computing power that was the driver behind the productivity boom of the late 1990’s. Productivity growth has also slowed in developing countries (Mexico and Turkey) which should be able to achieve greater output per worker with using technology.

2. Some have suggested that the problem lies in the way productivity is measured as statistical agencies sometime fail to include things like the massive reduction in the cost of digital media (free in most cases) subtracts from measured GDP – smartphones greatly improve productivity but are not captured by the statisticians. But the loss of productivity is far more than the estimates of the unmeasured gains from information technology. A ball park figure (Chad Syverson – University of Chicago) has the US economy losing $2.7 trillion in lost output since 2004 which equates to about $8,400 per person.

3. A further explanation is that inflexible developed economies are not efficient at moving people out of areas where there is no work to areas of growth. Business start-ups have fallen steadily since the late 1980’s. High growth companies have not expanded to other areas and have also preferred to bank profits rather than taking the option of reinvestment. An issue could be that if it was easier and cheaper to locate in depressed areas employment would rise.

Productivity

Machines or Labour in low paid jobs.

In order to boost productivity companies need more financial support for research and development and a reduction in government regulations – red tape. However low pay does allow companies to employ more people in marginal jobs as in some cases the cost of labour is less than the investment needed to introduce automation – checkouts in supermarkets for instance. But the abundance of cheap labour has led to firms to use that labour in less productive manner which leads to underemployment.


Productivity – Australia vs USA

Interesting graphic from the National Australia Bank showing productivity levels in Australia and the US. Labour productivity is a partial measure of overall productivity. The Australian Bureau of Statistics ABS also measures capital productivity and multi-factor productivity.

Labour productivity is calculated by the (ABS) as Gross Domestic Product per hour worked, and can be measured across various industry sectors or over the whole economy. The national Accounts, which show GDP per hour worked increased by 2.2 per cent in the year to June 2013. That compares to a 2 per cent increase in 2011-12, and a 0.4 per cent decline in 2010-11. The last time GDP per hour worked exceeded 2.2 per cent growth was in 2001-02 when it reached 3.6 per cent.

Aus v USA Prod

UK and US unemployment falls but for very different reasons

For both the newly appointed Governor of the Bank of England and the Chairwomen of the US Federal Reserve, Mark Carney and Janet Yellen respectively, the level of unemployment has been targeted as an indicator for increasing interest rates. It is encouraging that the unemployment rates have been dropping in both countries but for different reasons.

The flow chart below show that the US unemployment has dropped mainly because of the fact that people are leaving the workforce. Whilst across the Atlantic the UK’s fall in unemployment is more to do with conventional growth. However the US economy has experienced some significant growth which hasn’t feed through into more positive employment figures. On the contrary the UK economy has had weak growth but it has had little impact on employment figures. The Economist stated the following:

This divergence is commonly explained with nods to Britain’s “productivity puzzle”. America, the thinking goes, suffered a “normal” recession. Its low rate of inflation is symptomatic of weak demand, which can account for its output loss and much of the shortfall in jobs. In Britain, in contrast, tumbling demand has been matched by a strange decline in workers’ productivity. Falling productivity cushioned the economy against large job losses, since more workers were needed to do the same amount of work. But it also reflected a loss of productive capacity, the evidence for which was stubbornly high inflation. Since late 2007 annual inflation in Britain has been almost twice as high as in America, at 3.1% to 1.8%.

US UK unemp

NZ Productivity figures: 2008-2011

Here are some up to date statistics on New Zealand’s productivity from Grant Cleland of the Parliamentary Library in Wellington. He looks at the productivity of Labour, Capital and Multifactor.

Labour – is measured as a ratio of output to labour input. The change in labour productivity can also be broken into its component parts:
– The amount of capital available to be used by the labour force; and
– A change in multi-factor productivity (the change in output that cannot be attributed to a change in either capital or labour inputs).

The recent reduction in capital per worker (or, capital shallowing) could be the result of the recession, in that firms would have been unwilling to upgrade capital plant or invest in new plant when the demand for their goods and services was uncertain.

Capital – is measured as a ratio of output to capital input.

Multifactor – is growth that cannot be contributed to either capital or labour, such as an improvement in knowledge, methods or processes. An increase in multifactor productivity is commonly referred to as a technical change or efficiency growth.

US Productivity on the up.

Job creation has been a major concern for the United States economy as it tries to avoid a double-dip recession. US President Barack Obama recently promised to implement new tax incentives for companies that create jobs within the domestic economy – rewarding those that bring jobs into the US and eliminating tax breaks for companies that move jobs overseas. Although the unemployment rate in the US fell to 8.5% in December 2011, the lowest since February 2009, it is the impressive productivity figures which have gone largely unnoticed.

What are the reasons for this:

1. In 2012, with the weak economic conditions workers are concerned about job security so therefore tend to work longer hours and become more innovative in performing their job. This may involve them taking on more responsibility by doing other tasks.

2. When the recession bites, firms really have to think hard at how they can still maintain a revenue stream at the same time as seeing off the competition. This is where they become more innovative and risk further capital investment in order to remain solvent.

3. Panicked by the 2008 financial crisis and deepening recession, U.S. employers cut jobs pitilessly. They slashed an average of 780,000 jobs a month in the January-March quarter of 2009.

“My sense is there was much more weeding out of the weakest workers — the ones they didn’t want,” Kenneth Rogoff – Harvard University
—————————————————————————–
The above is a brief extract from an article published in this month’s econoMAX – click below to subscribe to econoMAX the online magazine of Tutor2u. Each month there are 8 articles of around 600 words on current economic issues.

econoMAX

Great site for infographics

A hat tip to colleague Richard Wells for this site – Column Five Media – which has some outstanding infographics. I particularly like the following:

* Grenade or Aid – US Military Spending versus Foreign Aid
* America’s Most Bizzare Taxes – Jock Tax, Candy Tax, Crack Tax.
* The CPI Market Basket – How the CPI is calculated and its impact on individuals
* How Coffee Affects the Global Economy – Value of exports and imports of coffee as well as coffee production.
* Europe Trails the US in Productivity – productivity figures for both countries and why Europe is behind. See graphic below.

GDP doesn’t necessarily mean jobs

Most of us would agree that when the levels of output in an economy start to pick up there is an expectation that employment will also increase and vice-versa. So why on the chart below has economic growth slowed at the same time that employment is starting to increase. According to Mark Doms (Chief Economist, US Department of Commerce) this result is not unusual. The graph below shows that there has been a surprisingly weak correlation between private sector job growth and GDP growth. In late 2009 and early 2010 there was good GDP growth but weak employment growth – 2009 Q4 there was 5% growth but a reduction of over 5,000 jobs. Why is there this weak relationship between jobs and growth? Doms comes up with the following reasons:

1. Quarterly changes is employment and GDP are volatile. Short-term numbers are erratic and most economists will take longer-term figures to remove the volatility.

2. Firms adjust the number of hours worked in addition to changing labour numbers.

3. Productivity growth can change significantly from one quarter to the next. In the current recovery there has been a large increase in the productivity of labour as firms start to cut slack in their production process. This means that they have obviously been able to produce more goods with fewer workers.