Chinese lending and underreported debt.

Most people will be aware of China’s presence in global trade but its growing influence in international finance seems to be relatively unknown mainly due to a lack of transparency and data. The vast majority of lending to Low Middle Income Countries (LMIC) is focused on infrastructure projects but China’s lending policy is obscure for a variety of reasons.

  • There is no published report of the China’s lending activity
  • As China is not a member of the Paris Club that shares bilateral lending and trade credit flows

The Paris Club is a group of 22 major creditor countries who try to find sustainable solutions to the payment difficulties experienced by debtor countries.

Features of Chinese loans

China by far the world’s largest official creditor, with outstanding claims in 2017 surpassing the loan books of the IMF, World Bank and of all other 22 Paris Club governments combined.  see graph.

Features of Chinese loans:

  • China lends at commercial rates – approx 4% – which is four times than that of a loan from the World Bank or an individual country.
  • China’s repayment period is generally shorter – less than 10 years which compares to approx 28 years for other lenders’ loans to LMIC.
  • China’s state-owned lenders require borrowers to maintain an offshore account which they have access to as security. This saves China having to go through the judicial process to recover funds.
  • Some countries are fast accumulating debt to China and for a lot of them the amount of debt owed has increased from less than 1% of debtor country GDP in 2005 to more than 15% in 2017. A dozen of these countries now owe debt of at least 20% of their nominal GDP to China.

Is China setting up debt traps?
There are mixed views on whether China keeps lending money to countries that can’t afford the repayment. This can result in China gaining part ownership of foreign assets as compensation for non-payment of a loan. Sri Lanka has been cited as an example of this in which there was considerable Chinese investment in a port project. However using loans and contractors from China proved contentious and Sri Lanka was left with growing debts. In 2017 consensus was reached which gave state-owned China Merchants a controlling 70% stake in the port on a 99-year lease in return for further Chinese investment.

However some reports suggest that the deal was driven by local political motivations, and China never took formal ownership of the port. In fact there are no instances of China seizing a major asset in the event of a loan default – AidData.

Why is there underreported debt? According to the China Africa Research Initiative there are five main reasons why countries have not reported debts to the World Bank.

  • World Bank rules on debt reporting only apply to countries actually borrowing from the World Bank. For instance when President Hugo Chavez of Venezuela pulled out of the World Bank after paying off loans, China then lent Venezuela US$90bn (21.1% of its GDP) which Venezuela was not required to disclose to the World Bank
  • Geopolitics also influences a country’s decision to disclose its debt. As well as Venezuela, Russia doesn’t report fully to the World Bank. For instance sanctions against a country will limit its ability to borrow from the World Bank.
  • Weak government capacities – if a country is afflicted by civil war they are often unable to report their borrowing. Sudan – overrun by conflict – stopped reporting loan commitments by China after 2010.
  • Deliberate hiding of foreign borrowing – loans to a country’s SOE’s may not be reported to the World Bank as domestic accounting systems keep SOE debt distinct from central government public debt. Mozambique has deliberately hidden loans from Swiss and Russian banks.
  • Chinese loan contracts – confidentiality clauses in them prevent borrower governments revealing the terms or even the existence of debt. Although more evidence is needed to prove this claim.

Why does underreported debt matter?
For policymakers in LMIC’s underreported debt is worthy of attention for the following reasons:

  • It can displace other public spending priorities that were planned and budgeted.
  • If a central government has a high level of debt exposure and this is underreported it will continue to borrow from lenders who are unaware of the risks. This can lead to an unsustainable accumulation of public debt.
  • It becomes very hard for for countries to resolve their debt crisis when they have such high underreported debt exposure. Creditors are likely to be less sympathetic to country’s who have underreported their debt exposure leading to litigation.

Sources

What is the Real Story of China’s “Hidden Debt”? by Deborah Brautigam and Yufan Huang. China Africa Research Initiative No. 6 2021.

China: Is it burdening poor countries with unsustainable debt? by Kai Wang – BBC Reality Check January 2022

Banking on the Belt and Road: Insights from a new global dataset of 13,427 Chinese development projects. Sep 29, 2021. Aid Data

Covid19 and unemployment – BBC Podcast

BBC World Service - The Real Story, Newshour Extra: Welcome

Below is a link to a very good podcast from the BBC ‘The Real Story’. Dan Damon discuss what should be done about rising unemployment in the age of Covid-19? Contributors include Australian economist Steve Keen author of ‘Debunking Economics’. Topics of debate include:

  • Universal Basic Income
  • Modern Monetary Theory
  • How much debt can a government sustain in propping up an economy?
  • Should a government subsidise companies taking-on workers?

Also features a very good interview with Daniel Susskind – author of ‘A World Without Work: Technology, Automation and How We Should Respond’

It is 53 minutes long but can take your mind off the commute to work.

https://www.bbc.co.uk/programmes/w3cszcnf

Public debt – how high can it go?

From the Economist – good video on government bonds and debt through the ages with some great graphics.

It asks the question is government debt a concern today? They state that as long as a country’s GDP is growing faster than the country’s debt accumulating in interest then it grow its way out of debt with no fiscal cost. It also questions why interest rates today are low? Central banks such as the RBNZ and the US Federal Reserve set the interest rates and will keep them low until the economy starts some sort of recovery. They are able to do this as there is little to no inflationary pressure in the economy – remember most central banks have an inflationary target. This does mean that savers lose out as the return they get is very low. Furthermore implementing a programme of quantitative easing floods the market with cash which in turn leads to a lower cost of borrowing.

RBNZ cut OCR but little mention of Trump

Although the attention this morning was on the election of Donald Trump as US President the RBNZ cut the OCR to 1.75% with a mild easing bias of “numerous uncertainties remain, particularly in respect of the international outlook, and policy may need to adjust accordingly”. nz-cpi-nov-16

It is expected that the OCR will remain at this level in the near future with inflation expected to be back within the 1-3% Policy Target Agreement (PTA) by the end of January next year – see graph from ASB Bank. The reason for this is that:

  • Dairy prices have recovered considerably.
  • The labour market is tightening.
  • Growth is running at an above-trend pace.
  • The OCR is already at an expansionary rate and the economy.

Could there be another cut in the OCR? There would be pressure if the following eventuated:

  • there is a strengthening of the NZ dollar,
  • increasing bank funding costs,
  • any further weakness in inflation expectations,
  • any deterioration in the global growth outlook.

The change of US Presidency will also be a wildcard over the longer term, with its mix of potential fiscal stimulus and trade protectionism. Trump has already signaled that he is not keen to sign TPP and he wants to reopen the NAFTA – North America Free Trade Agreement. Furthermore, he might take umbrage on the Chinese with their manipulation of the Yuan to advantage its exports and put a large tariff on its goods coming into the US. For New Zealand it may mean that they have to go down the bi-lateral agreement option in order to increase trade.

Other than the US election, Graeme Wheeler needs to be aware of the following:

  • Theresa May has indicated she wants to trigger Article 50 by May 2017 – it is very unclear what the process will be and the negotiating strategy of both the UK and the EU. This could have implications for NZ trade.
  • In China the increasing of centalised  power of the President.
  • China has a huge amount of corporate debt relative to GDP – see graph below.
  • Brazil is still in recession
  • Russia still has issues in the Middle East

China Corporate debt.png

New Zealand Household Debt

Household debt in New Zealand is now equivalent to 163% of annual household disposable income – see graph below. Record low interest rates has seen credit growth rising at a pace not seen since 2008. How do low interest rates contribute to this?

Household debt as a share of disposable income (including investment housing)

house-debt-dis-inc

Low borrowing rates have made it easier to purchase property with bank funds especially as the supply of housing hasn’t matched the increase in demand. The strong growth in property prices has meant that those who already own a house are using that security to purchase additional property. According to the IMF New Zealand has the highest ‘House Price-to-Income Ratio’ – see graph below.

house-price-income-ratio

Other parts of the world are experiencing high household-debt to income levels (see graph below) but does high debt levels mean that the economy is going to hit a major recession? Since the credit crisis of 2008 the global financial system has seen tighter regulations put in place to improve stability with banks limiting access to credit so there is less exposure to the risks associated with highly leverage lending.

Growth in house prices and household credit 2011 – 2015.

house-prices-household-credit

However debt servicing remains tolerable with low interest rates and much of the debt secured against investment housing. Also debt-to-asset ratios have fallen to levels that were experienced in 2007 but this has eventuated from low interest rates which have boosted house prices. Ultimately with a fall in house prices, and depending on its severity, those who recently entered the property market would suffer some degree of hardship whilst those already well established in the market might have a financial  buffer.

Debt and future growth in New Zealand

Household debt still has implications for the long-term growth of the economy.

  1. With larger proportions of their income being allocated to debt consumers have less disposable income for other goods and services which creates less aggregate demand.
  2. High debt levels mean households have more exposure to unfavorable economic conditions that could lead to rising unemployment. In this case they have less money to fall back on.

Source: Westpac Economics Overview – August 2016

10 Economic Myths from the New Internationalist

The December 2015 edition of the New Internationalist discussed 10 Economic Myths that need to be addressed especially after the GFC. Below is the list and the NI goes through each in detail – click here to go to the NI website.

Myth 1: Austerity will lead to ‘jobs and growth – ‘
It’s wrong to sell austerity as a cure for economic woes
Myth 2: Deficit reduction is the only way out of a slump 
- Don’t rely on those who caused the crash to resolve it
Myth 3: Taxing the rich scares off investors and stalls economic performance
 – Taxation creates prosperity just as much as private enterprise
Myth 4: Economic migrants are a drain on rich world economies
 – Migration follows a demand for labour and benefits the receiving country
Myth 5: The private sector is more efficient than the public sector
 – There is no evidence of greater efficiency
Myth 6: Fossil fuels are more economically viable than renewables
 – Not if you look at the environmental costs
Myth 7: Financial regulation will destroy a profitable banking sector
 – Why should financial markets be accountable only to themselves?
Myth 8: Organized labour is regressive – 
It can be argued that the opposite is actually true.
Myth 9: Everyone has to pay their debts
 – We need debt management not reduction
Myth 10: Growth is the only way
 – why we need to find another way, fast.

Although it is repetitive in places especially when they talk of debt and austerity it does provide some valid arguments. I think that the last myth ‘Growth is the only way’ is of particular importance in that GDP growth at all costs has led to wasteful resource use, particularly by the wealthier countries, on an unparalleled scale and without a backward glance. It is often noted that the economy is a subset of the ecological system, but equally there seems to be a belief that nature can cope with anything we throw at it. However, an assessment by the Global Footprint Network indicates we are running a dangerous ecological debt. Currently the global use of resources and amounts of waste generated per year would require one and a half planet Earths to be sustainable (see graph below). The price to be paid for this overshoot is ecological crises (think forests, fisheries, freshwater and the climatic system), a price that is again paid disproportionately by the poor.

ecological footprint

If only Greece owned Apple

Apple Greece bailoutA HT to colleague David Parr for this piece from The Sydney Morning Herald. Apple are currently worth $US194 billion in cash and securities which equates to €178 billion. This means that Apple have enough to cover the €86 billion Greek bailout deal struck earlier in the week twice over — with a cool €6 billion still left over to maybe buy an island or a port. If Apple were a country, it’d be the 55th richest country in the world.

According to the World Bank’s most recent data on national wealth, Apple is now worth more than the following countries:

Belarus – worth $467 billion
El Salvadore – worth $364 billion
Guatemala – worth $548 billion
Iceland – worth – $268 billlion
Jamaica – worth $211 billion
Kenya – worth $366 billion
Luxembourg – worth $419 billion
Mongolia – worth $34 billion
Nepal – worth $151 billion
Nicaragua – worth $101 billion
Sri Lanka – worth $424 billion
Tunisia – worth $475 billion

New Zealand’s debt

NZ debt %GDPBrian Gaynor in the NZ Herald wrote an article on New Zealand’s debt position. There are two important figures to note:

1. Gross external debt, which is the country’s total overseas debt.
2. Net external dent, which is determined by subtracting New Zealand’s gross overseas lending from its gross external debt.

New Zealand Government debt is currently $54.9 billion with total Government debt (external plus domestic) representing 38% of GDP. This is low by international standards. The biggest contributors to New Zealand’s external external debt are the registered banks which now account for $117.9 billion. The banks increased their overseas borrowings from $55.2 billion in 2001 to 139.5 billion in 2008. However since the GFC, banks have reduced their borrowing from overseas by $21.9 billion which is a positive development. However the big concern for New Zealand is that with a small financial market domestic borrowers source a lot of their debt from overseas lenders. New Zealand would be in a much stronger position if its financial markets could fund domestic borrowers.

Syriza’s rescue programme for Greece “ pure Keynesian policies”

A number of articles from The New Yorker magazine have outlined the problems facing Greece’s anti-austerity party Syriza. The party came to power on the election promise of reducing Greece’s debt burden and to liberate Greece from the Troika – the ECB, the IMF and the European Commission. However the extension recently granted to Greece will take place only within the framework of the existing arrangement. The budgetary targets for 2015 and 2016 have kept the economy stuck in recession.

* the Greek economy has contracted by 30% since 2008.
* 25% of the workforce are officially unemployed
* 50% of those under 24 years of age are unemployed
* 40% of Greek children live below the poverty line.

Money has been flowing out of the economy leaving the banking system on the verge of collapse see graphic from The Economist.

As with the Keynesian doctrine, Syriza’s solution in to create effective demand by pumping money into the system. One economics professor at the University of Athens called it “pure Keynesian policies. The big question is where will the money come from although some seem to think that it can raise revenue from tackling corruption and tax evasion. The latter is widespread in Greece amongst the upper-middle class and the very rich – the top-most bracket of households and businesses are responsible for 80% of the total tax debt owed to the government.

Greece’s creditors were mostly European banks, which had, in part, used public bailout money following the 2008 credit crunch to scoop up Greek bonds. For example, French and German banks were on the books for thirty-one and twenty-three billion euros, respectively. The troika stepped in during the spring of 2010, and again in 2012, to orchestrate bailouts of the Greek government, offering two hundred and forty billion euros in loans in exchange for a drastic reduction in government spending and other measures to make the Greek economy more competitive. Source: New Yorker

Grexit
The conventional wisdom is that returning to the drachma would be a catastrophe for Greece. There are pros and cons to this decision – the following would be concerns about returning to the drachma:
* An immediate devaluation;
* The value of savings would tumble;
* The price of imported goods would soar.

However on the positive side of things you would get the following:
* Greek exports would become cheaper
* Labour costs even more competitive.
* Tourism would likely boom.
* Regaining control of its monetary and fiscal policy for the first time since 2001

It would give Greece the chance to deal with its economic woes. Other countries that have endured sudden devaluations have often found that long-term gain outweighs short-term pain. When Argentina defaulted and devalued the peso, in 2001, months of economic chaos were followed by years of rapid growth. Iceland had a similar experience after the financial crisis. The Greek situation would entail an entirely new currency rather than just a devaluation.
This conflict is as much about the ideology of austerity and whether smaller countries will have a meaningful say in their own economic fate. However one needs look back in history to remember that in debt-saddled Weimar German, humiliation and dispossession festered until it a gave rise to the Nazi party. Greece’s neo-nazi party won the third greatest number of parliament seats in the last election.

Greek Bonds

The New Zealand economy cannot live on debt forever

Brian Gaynor in the NZ Herald wrote a piece on the amount of debt in the New Zealand economy and the fact that the Reserve Bank needs some fresh ideas to stem the increasing trend. With the OCR increasing this week to 3.5% the disposable income of the floating mortgage holder will reduce and ultimately impact on their ability to spend – floating mortgages represent 33% of all mortgages in dollar terms. Although higher rates help those that have money in the bank however a lot of this is from overseas investors so interest payments leave the economy. Furthermore the elderly tend to have savings in banks but they are not seen as significant spenders. The higher interest rates also attract ‘hot money’ as NZ’s rates are higher than most other industrialised countries.

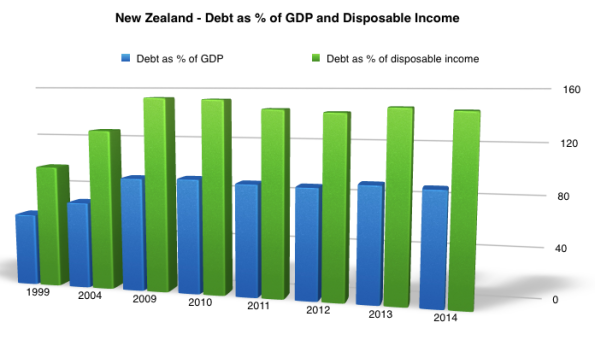
The amount of debt in the economy is a major concern especially when you consider how much is mortgage debt – see below. Also the fact that debt as % GDP is now 88.5% and 145% of disposable income – this is putting pressure on inflation not forgetting that people are living very much beyond their means.

NZ debt 2014

The RBNZ is concerned with this debt and introduced restrictions on high loan-to-value residential mortgage lending. They see that there is too much emphasis on housing which is being fuelled by greater access to debt. One only has to look at the Irish property to see how things can wrong – house prices dropped 50% between 2007 and 2012.

NZ Debt % GDP

Global Financial Instability Flow Chart

Below is a flow chart that shows some of the causes of financial instability in the global economy. Below are the the main points:

* The mismatch in the banking system with regards to paying debt
* Low interest rates and lack collateral required means more lending
* Good debt – productive use in capital investment (however very limited in most countries)
* Bad debt – non-productive assets used for speculation purposes (popular with investors)
* Capital Flows – Governments can fund current a/c deficits with borrowing from overseas
* From this further increases in the supply of money and therefore lending.
* Ends with a property bubble.

Financial Instability

New Zealand’s Foreign Debt Servicing

Lower interest rates has a positive effect on debt servicing costs. As a % of exports foreign debt servicing has fallen from 20.8% in 2007 to 10.6% at the start of 2013. However there is concern about the longer term effects of lower interest rates and the impact it will have on the housing market in NZ. If the CPI is pushes up towards the 3% the RBNZ may be forced to increase interest rates which influences the strength of the NZD and debt servicing. Furthermore, because net debt continues to increase indefinitely in the historic trends scenario, financing costs also increase exponentially. Below are graphs showing NZ’s debt servicing costs and explaining the debt spiral.

Foreign debt servicing

Debt spiral